

Question: (a) (10 marks) The table below shows current and expected future one-year interest rates, as well as current interest rates on multiyear bonds. Use
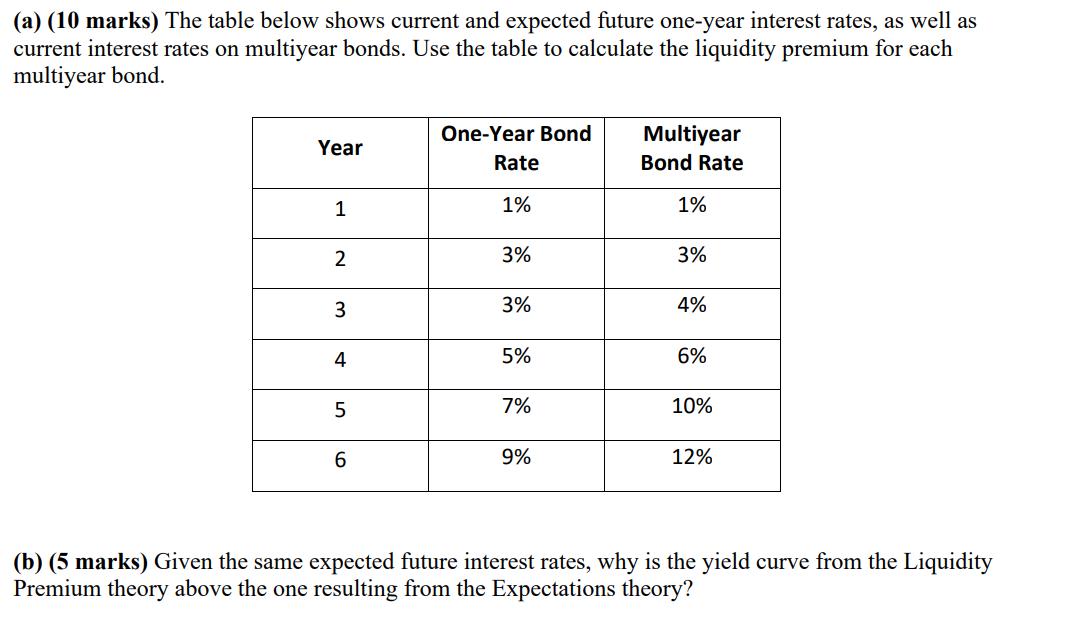
(a) (10 marks) The table below shows current and expected future one-year interest rates, as well as current interest rates on multiyear bonds. Use the table to calculate the liquidity premium for each multiyear bond. One-Year Bond Multiyear Year Rate Bond Rate 1 1% 1% 2 3% 3% 3 3% 4% 4 5% 6% 5 7% 10% 6 9% 12% (b) (5 marks) Given the same expected future interest rates, why is the yield curve from the Liquidity Premium theory above the one resulting from the Expectations theory?
Step by Step Solution
There are 3 Steps involved in it
1 Expert Approved Answer
Step: 1 Unlock

Question Has Been Solved by an Expert!
Get step-by-step solutions from verified subject matter experts
Step: 2 Unlock
Step: 3 Unlock