

Question: a 12 7.5 The following table reports forecasted returns for the stock of two different companies under three possible states of the economy: State Probability
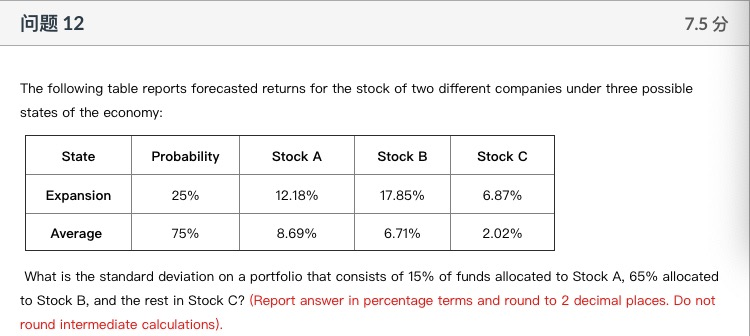
a 12 7.5 The following table reports forecasted returns for the stock of two different companies under three possible states of the economy: State Probability Stock A Stock B Stock C Expansion 25% 12.18% 17.85% 6.87% Average 75% 8.69% 6.71% 2.02% What is the standard deviation on a portfolio that consists of 15% of funds allocated to Stock A, 65% allocated to Stock B, and the rest in Stock C? (Report answer in percentage terms and round to 2 decimal places. Do not round intermediate calculations)
Step by Step Solution
There are 3 Steps involved in it
1 Expert Approved Answer
Step: 1 Unlock

Question Has Been Solved by an Expert!
Get step-by-step solutions from verified subject matter experts
Step: 2 Unlock
Step: 3 Unlock