

Question: (a) (15pts) Write MATLAB code to plot the functions A(z)-cos(z) sin(2x), fa(x) Vx + 15 sin(x), /s(z)=ez/10 as r ranges from -10 to 10 in
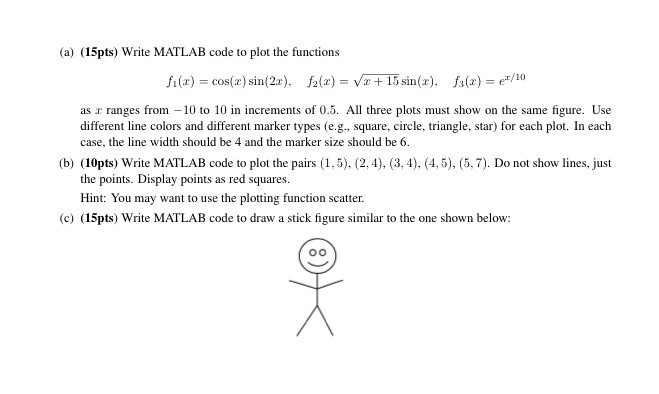
(a) (15pts) Write MATLAB code to plot the functions A(z)-cos(z) sin(2x), fa(x) Vx + 15 sin(x), /s(z)=ez/10 as r ranges from -10 to 10 in increments of 0.5. All three plots must show on the same figure. Use different line colors and different marker types (e.g., square, circle, triangle, star for each plot. In each case, the line width should be 4 and the marker size should be 6 (b) (10pts) Write MATLAB code to plot the pairs (1.5). (2,4). (3, 4). (4,5). (5,7). Do not show lines, just the points. Display points as red squares. Hint: You may want to use the plotting function scatter. (c) (15pts) Write MATLAB code to draw a stick figure similar to the one shown below: 0O
Step by Step Solution
There are 3 Steps involved in it

Get step-by-step solutions from verified subject matter experts