

Question: . A 2012 survey conducted by Idea Works provided data showing the percentage of seats available when customers try to redeem points or miles for
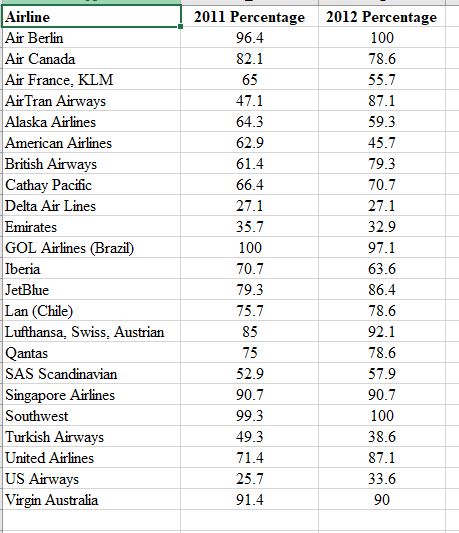
.A 2012 survey conducted by Idea Works provided data showing the percentage of seats available when customers try to redeem points or miles for free travel. For each airline listed, the column labeled 2011 Percentage shows the percentage of seats available in 2011 and the column labeled 2012 shows the corresponding percentage in 2012(The Wall Street Journal, May 17, 2012). UseAirlineSeats.xlsx
a)Develop a scatter diagram with 2011 Percentage as the independent variable and fit the regression line. Label the axis appropriately
b)What does the scatter diagram developed in part (a) indicate about the relationship between the two variables?
c)Using Data Analysis ToolPak develop the estimated regression equation.
d)Test for a significant relationship. Use 0.05 level of significance
e)Did the estimated regression equation provide a good fit?
f)Construct a residual plot. Comment on the shape of the plot as well as any unusual looking points.
\f
Step by Step Solution
There are 3 Steps involved in it

Get step-by-step solutions from verified subject matter experts