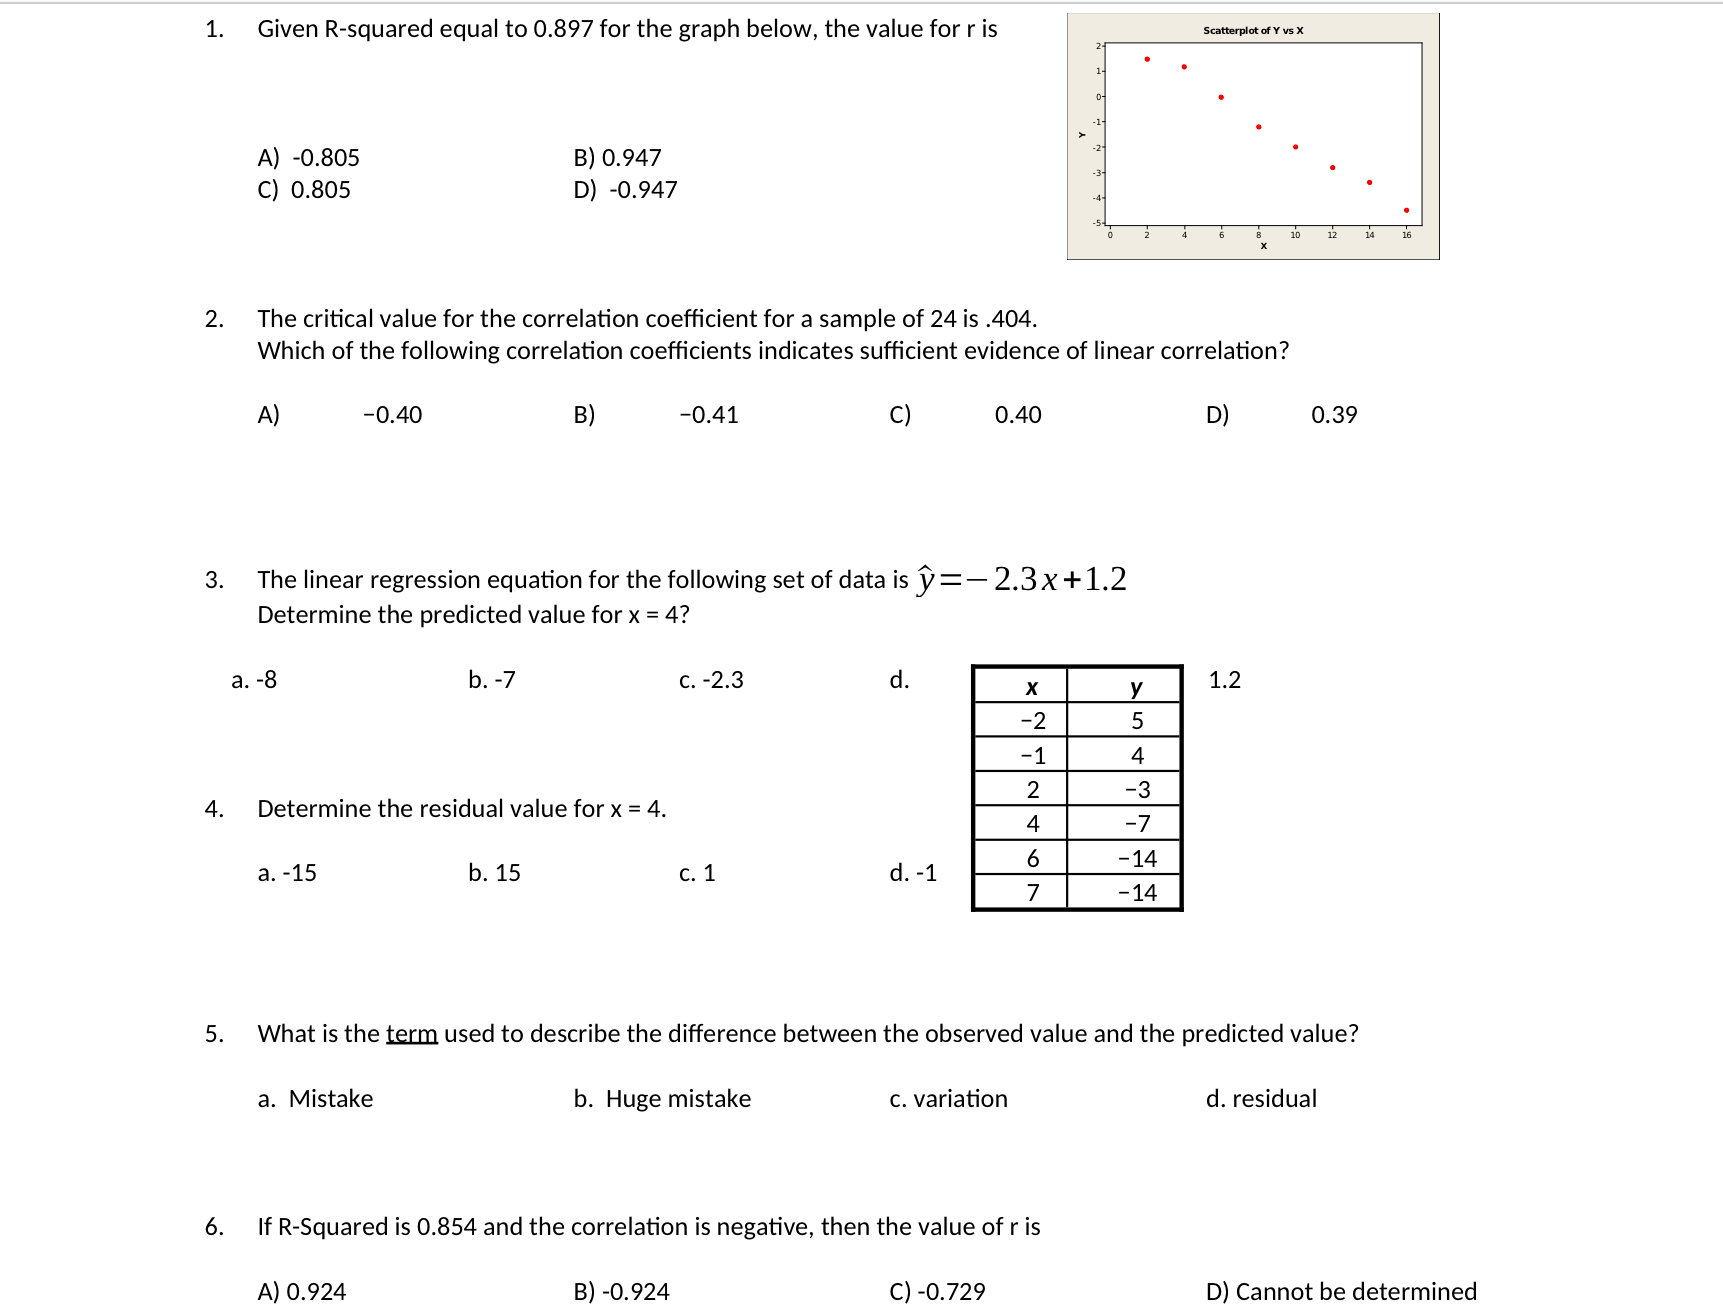
Question: a. -8 b. -7 c. -2.3 d. Given R-squared equal to 0.897 for the graph below, the value for r is Seatterplet of vs x

a. -8 b. -7 c. -2.3 d. Given R-squared equal toa. -8 b. -7 c. -2.3 d. Given R-squared equal toa. -8 b. -7 c. -2.3 d. Given R-squared equal to
a. -8 b. -7 c. -2.3 d. Given R-squared equal to 0.897 for the graph below, the value for r is Seatterplet of vs x A) -0.805 B) 0.947 C) 0.805 D) -0.947 ob ye ee ew . The critical value for the correlation coefficient for a sample of 24 is .404. Which of the following correlation coefficients indicates sufficient evidence of linear correlation? A) -0.40 B) -0.41 Cc) 0.40 D) 0.39 The linear regression equation for the following set of data is y= 2.3x+1.2 Determine the predicted value for x = 4? Determine the residual value for x = 4. a. -15 b. 15 al d.-1 What is the term used to describe the difference between the observed value and the predicted value? a. Mistake b. Huge mistake c. variation d. residual If R-Squared is 0.854 and the correlation is negative, then the value of r is A) 0.924 B) -0.924 C) -0.729 D) Cannot be determined If R-Squared is 0.854 and the correlation is negative, then the value of r is A) 0.924 B) -0.924 C) -0.729 D) Cannot be determined Given r = -.845, the value of R-squared is a. 0.714 b. -0.714 G. 0.919 d. -0.919 The predicted value for a point, x = 17, is 52.75. If the residual is negative, which choice could represent the y-value of the actual value? A point that is above the regression line (line of best fit) A point that is on the regression line A point that is below the regression line There is no way to tell since we don't know the equation of the regression line. ao op 9. The linear regression equation for the following set of data is y =0.56 - 0.44x N X 4 What is the predicted value for x = 4? 2 4 -7 -14 7 -14 Robbery Aggravated Use the data in table for 9 - 11 City (x) Assault (y) New York 288 330 Listed in the table below are the robbery and aggravated Los Angeles 370 377 assault rates (occurrences per 100,000) for the 12 most Chicago 555 610 populated U.S. cities in 2006. Houston 548 562 Phoenix 288 398 Philadelphia 749 720 10. Determine if r = 0.703 is significant (use your table). Las Vegas 409 508 San Antonio 180 389 Explain what your answer means. San Diego 171 301 Dallas 554 584 San Jose 112 248 Honolulu 105 169 . State R2 and explain its meaning. 12. Use the regression equation, y = 157.49 + 0.76x to determine the best estimate for a city with 150 robberies

Step by Step Solution

There are 3 Steps involved in it

1 Expert Approved Answer
Step: 1 Unlock blur-text-image
Question Has Been Solved by an Expert!

Get step-by-step solutions from verified subject matter experts

Step: 2 Unlock
Step: 3 Unlock

Students Have Also Explored These Related Mathematics Questions!