

Question: A. (8 points) We have discussed Porters Five Forces throughout the semester. Based ONLY on what you see in the above table, what conclusions might
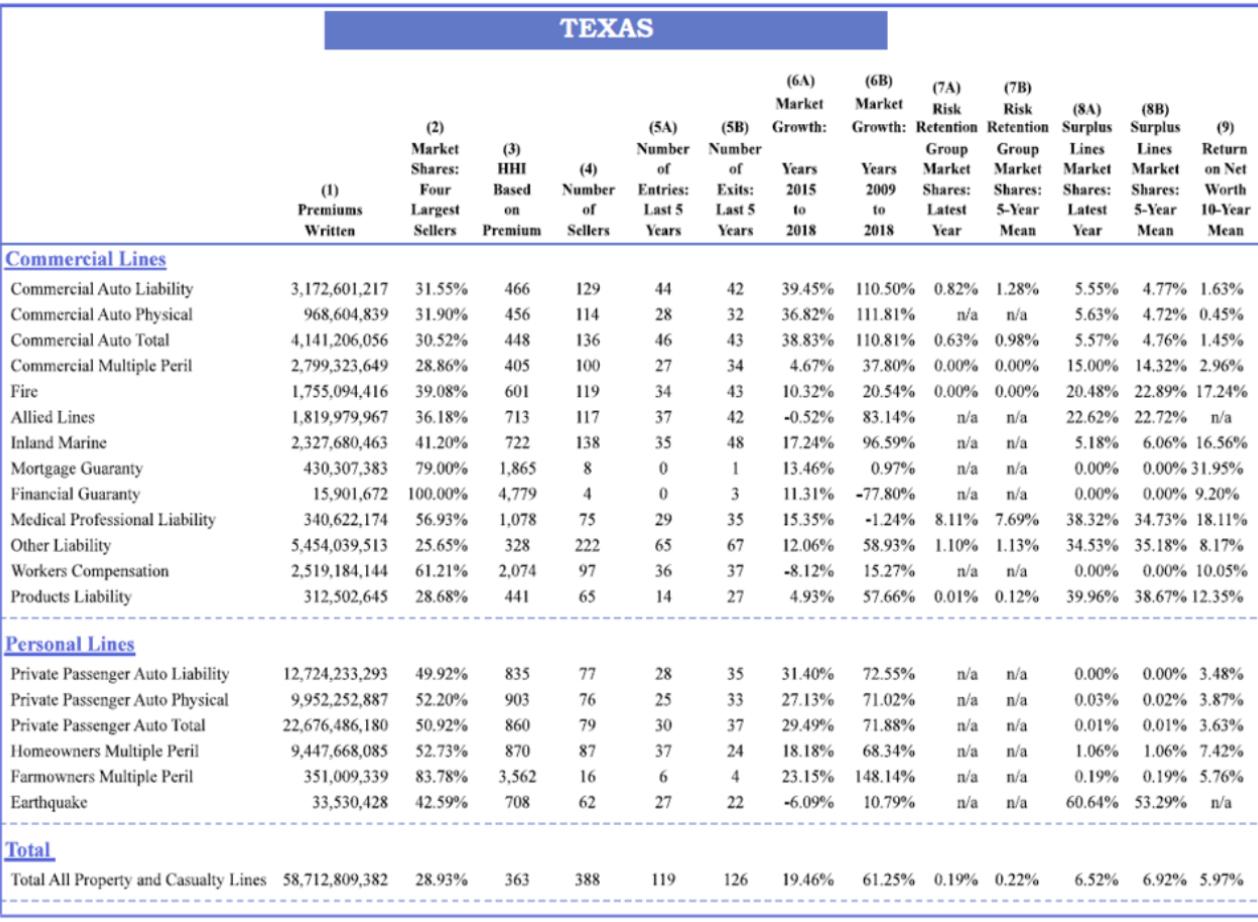
A. (8 points) We have discussed Porters Five Forces throughout the semester. Based ONLY on what you see in the above table, what conclusions might you draw about the Five Forces? This question is NOT a library research project. Use only your class notes, the textbook and the Table to answer the following questions. Based ONLY on what you see in the above table, what conclusions might you draw about the Five Forces and the Texas Medical Professional Liability Industry? Do any of the Five Forces stand out for the industry? If you cannot draw conclusions about one or more of the Five Forces from the table, that is ok. Your discussion should conclude with an overall assessment of the attractiveness of the industry. B. (7 points) We have discussed Porters Five Forces throughout the semester. Based ONLY on what you see in the above table, what conclusions might you draw about the Five Forces? This question is NOT a library research project. Use only your class notes, the textbook and the Table to answer the following questions. Based ONLY on what you see in the above table, what conclusions might you draw about the Five Forces and the Texas Private Passenger Auto Liability Industry? Do any of the Five Forces stand out for the industry? If you cannot draw conclusions about one or more of the Five Forces from the table, that is ok. Your discussion should conclude with an overall assessment of the attractiveness of the industry.
PLEASE HELP ME !!!!!
TEXAS Market (8B) (2) (5A) (6A) (6B) (7A) (73) Market Risk Risk (8A) ) (5B) Growth: Growth: Retention Retention Surplus Surplus Market (3) Number Number Group Group Lines Lines Shares: HHI of of Years Years Market Market Market Market Four Based Number Entries: Exits: 2015 2009 Shares: Shares: Shares: Shares: Largest on Last 5 Last 5 to to Latest 5-Year Latest 5-Year Sellers Premium Sellers Years Years 2018 2018 Year Mean Year Mean (9) Return on Net Worth 10-Year Mean Premiums Written 42 44 28 32 Commercial Lines Commercial Auto Liability Commercial Auto Physical Commercial Auto Total Commercial Multiple Peril Fire Allied Lines Inland Marine Mortgage Guaranty Financial Guaranty Medical Professional Liability Other Liability Workers Compensation Products Liability 46 27 34 43 34 43 3,172,601,217 31.55% 968,604,839 31.90% 4,141,206,056 30.52% 2,799,323,649 28.86% 1,755,094,416 39.08% 1,819,979,967 36.18% 2,327,680,463 41.20% 430,307,383 79.00% 15,901,672 100.00% 340,622,174 56.93% 5,454,039,513 25.65% 2,519,184,144 61.21% 312,502,645 28.68% 129 114 136 100 119 117 138 1:1 271815153 466 456 448 405 601 713 722 1,865 4.779 1.078 328 2,074 441 42 37 35 48 39.45% 110.50% 0.82% 1.28% 36.82% 111.81% n/a n/a 38.83% 110.81% 0.63% 0.98% 4.67% 37.80% 0.00% 0.00% 10.32% 20.54% 0.00% 0.00% -0.52% 83.14% n/a n/a a 17.24% 96.59% n/a 13.46% 0.97% n/a n/a 11.31% -77.80% n/a n/a 15.35% - 1.24% 8.11% 7.69% 12.06% 58.93% 1.10% 1.13% -8.12% 15.27% n/a n/a 4.93% 57.66% 0.01% 0.12% n/a 5.55% 4.77% 1.63% 5.63% 4.72% 0.45% 5.57% 4.76% 1,45% 15.00% 14.32% 2.96% 20.48% 22.89% 17.24% 22.62% 22.72% n/a 5.18% 6.06% 16.56% 0.00% 0.00% 31.95% 0.00% 0.00% 9.20% 38.32% 34.73% 18.11% 34.53% 35.18% 8.17% 0.00% 0.00% 10.05% 39.96% 38,67% 12.35% 0 0 29 1 3 35 222 65 67 36 14 37 27 35 Personal Lines Private Passenger Auto Liability Private Passenger Auto Physical Private Passenger Auto Total Homeowners Multiple Peril Farmowners Multiple Peril Earthquake 77 76 79 28 25 30 33 37 12,724,233,293 49.92% 9,952,252,887 52.20% 22,676,486,180 50.92% 9,447,668,085 52.73% 351,009,339 83.78% 33,530,428 42.59% 835 903 860 870 3,562 708 31.40% 72.55% 27.13% 71.02% 29.49% 71.88% 18.18% 68.34% 23.15% 148.14% -6.09% 10.79% n/a n/a n/a n/a n/a n/a n/a n/a n/a / n/a n/a 0.00% 0.00% 3.48% 0.03% 0.02% 3.87% 0.01% 0.01% 3.63% 1.06% 1.06% 7.42% 0.19% 0.19% 5.76% 60.64% 53.29% n/a 87 37 24 n/a 6 4 16 62 27 22 Total Total All Property and Casualty Lines 58,712,809,382 28.93% 363 388 119 126 19.46% 61.25% 0.19% 0.22% 6.52% 6.92% 5.97% TEXAS Market (8B) (2) (5A) (6A) (6B) (7A) (73) Market Risk Risk (8A) ) (5B) Growth: Growth: Retention Retention Surplus Surplus Market (3) Number Number Group Group Lines Lines Shares: HHI of of Years Years Market Market Market Market Four Based Number Entries: Exits: 2015 2009 Shares: Shares: Shares: Shares: Largest on Last 5 Last 5 to to Latest 5-Year Latest 5-Year Sellers Premium Sellers Years Years 2018 2018 Year Mean Year Mean (9) Return on Net Worth 10-Year Mean Premiums Written 42 44 28 32 Commercial Lines Commercial Auto Liability Commercial Auto Physical Commercial Auto Total Commercial Multiple Peril Fire Allied Lines Inland Marine Mortgage Guaranty Financial Guaranty Medical Professional Liability Other Liability Workers Compensation Products Liability 46 27 34 43 34 43 3,172,601,217 31.55% 968,604,839 31.90% 4,141,206,056 30.52% 2,799,323,649 28.86% 1,755,094,416 39.08% 1,819,979,967 36.18% 2,327,680,463 41.20% 430,307,383 79.00% 15,901,672 100.00% 340,622,174 56.93% 5,454,039,513 25.65% 2,519,184,144 61.21% 312,502,645 28.68% 129 114 136 100 119 117 138 1:1 271815153 466 456 448 405 601 713 722 1,865 4.779 1.078 328 2,074 441 42 37 35 48 39.45% 110.50% 0.82% 1.28% 36.82% 111.81% n/a n/a 38.83% 110.81% 0.63% 0.98% 4.67% 37.80% 0.00% 0.00% 10.32% 20.54% 0.00% 0.00% -0.52% 83.14% n/a n/a a 17.24% 96.59% n/a 13.46% 0.97% n/a n/a 11.31% -77.80% n/a n/a 15.35% - 1.24% 8.11% 7.69% 12.06% 58.93% 1.10% 1.13% -8.12% 15.27% n/a n/a 4.93% 57.66% 0.01% 0.12% n/a 5.55% 4.77% 1.63% 5.63% 4.72% 0.45% 5.57% 4.76% 1,45% 15.00% 14.32% 2.96% 20.48% 22.89% 17.24% 22.62% 22.72% n/a 5.18% 6.06% 16.56% 0.00% 0.00% 31.95% 0.00% 0.00% 9.20% 38.32% 34.73% 18.11% 34.53% 35.18% 8.17% 0.00% 0.00% 10.05% 39.96% 38,67% 12.35% 0 0 29 1 3 35 222 65 67 36 14 37 27 35 Personal Lines Private Passenger Auto Liability Private Passenger Auto Physical Private Passenger Auto Total Homeowners Multiple Peril Farmowners Multiple Peril Earthquake 77 76 79 28 25 30 33 37 12,724,233,293 49.92% 9,952,252,887 52.20% 22,676,486,180 50.92% 9,447,668,085 52.73% 351,009,339 83.78% 33,530,428 42.59% 835 903 860 870 3,562 708 31.40% 72.55% 27.13% 71.02% 29.49% 71.88% 18.18% 68.34% 23.15% 148.14% -6.09% 10.79% n/a n/a n/a n/a n/a n/a n/a n/a n/a / n/a n/a 0.00% 0.00% 3.48% 0.03% 0.02% 3.87% 0.01% 0.01% 3.63% 1.06% 1.06% 7.42% 0.19% 0.19% 5.76% 60.64% 53.29% n/a 87 37 24 n/a 6 4 16 62 27 22 Total Total All Property and Casualty Lines 58,712,809,382 28.93% 363 388 119 126 19.46% 61.25% 0.19% 0.22% 6.52% 6.92% 5.97%
Step by Step Solution
There are 3 Steps involved in it

Get step-by-step solutions from verified subject matter experts