

Question: ( a ) A cone penetrometer test was carried out on a soil sample with the following results. Plot the graph and determine the Liquid
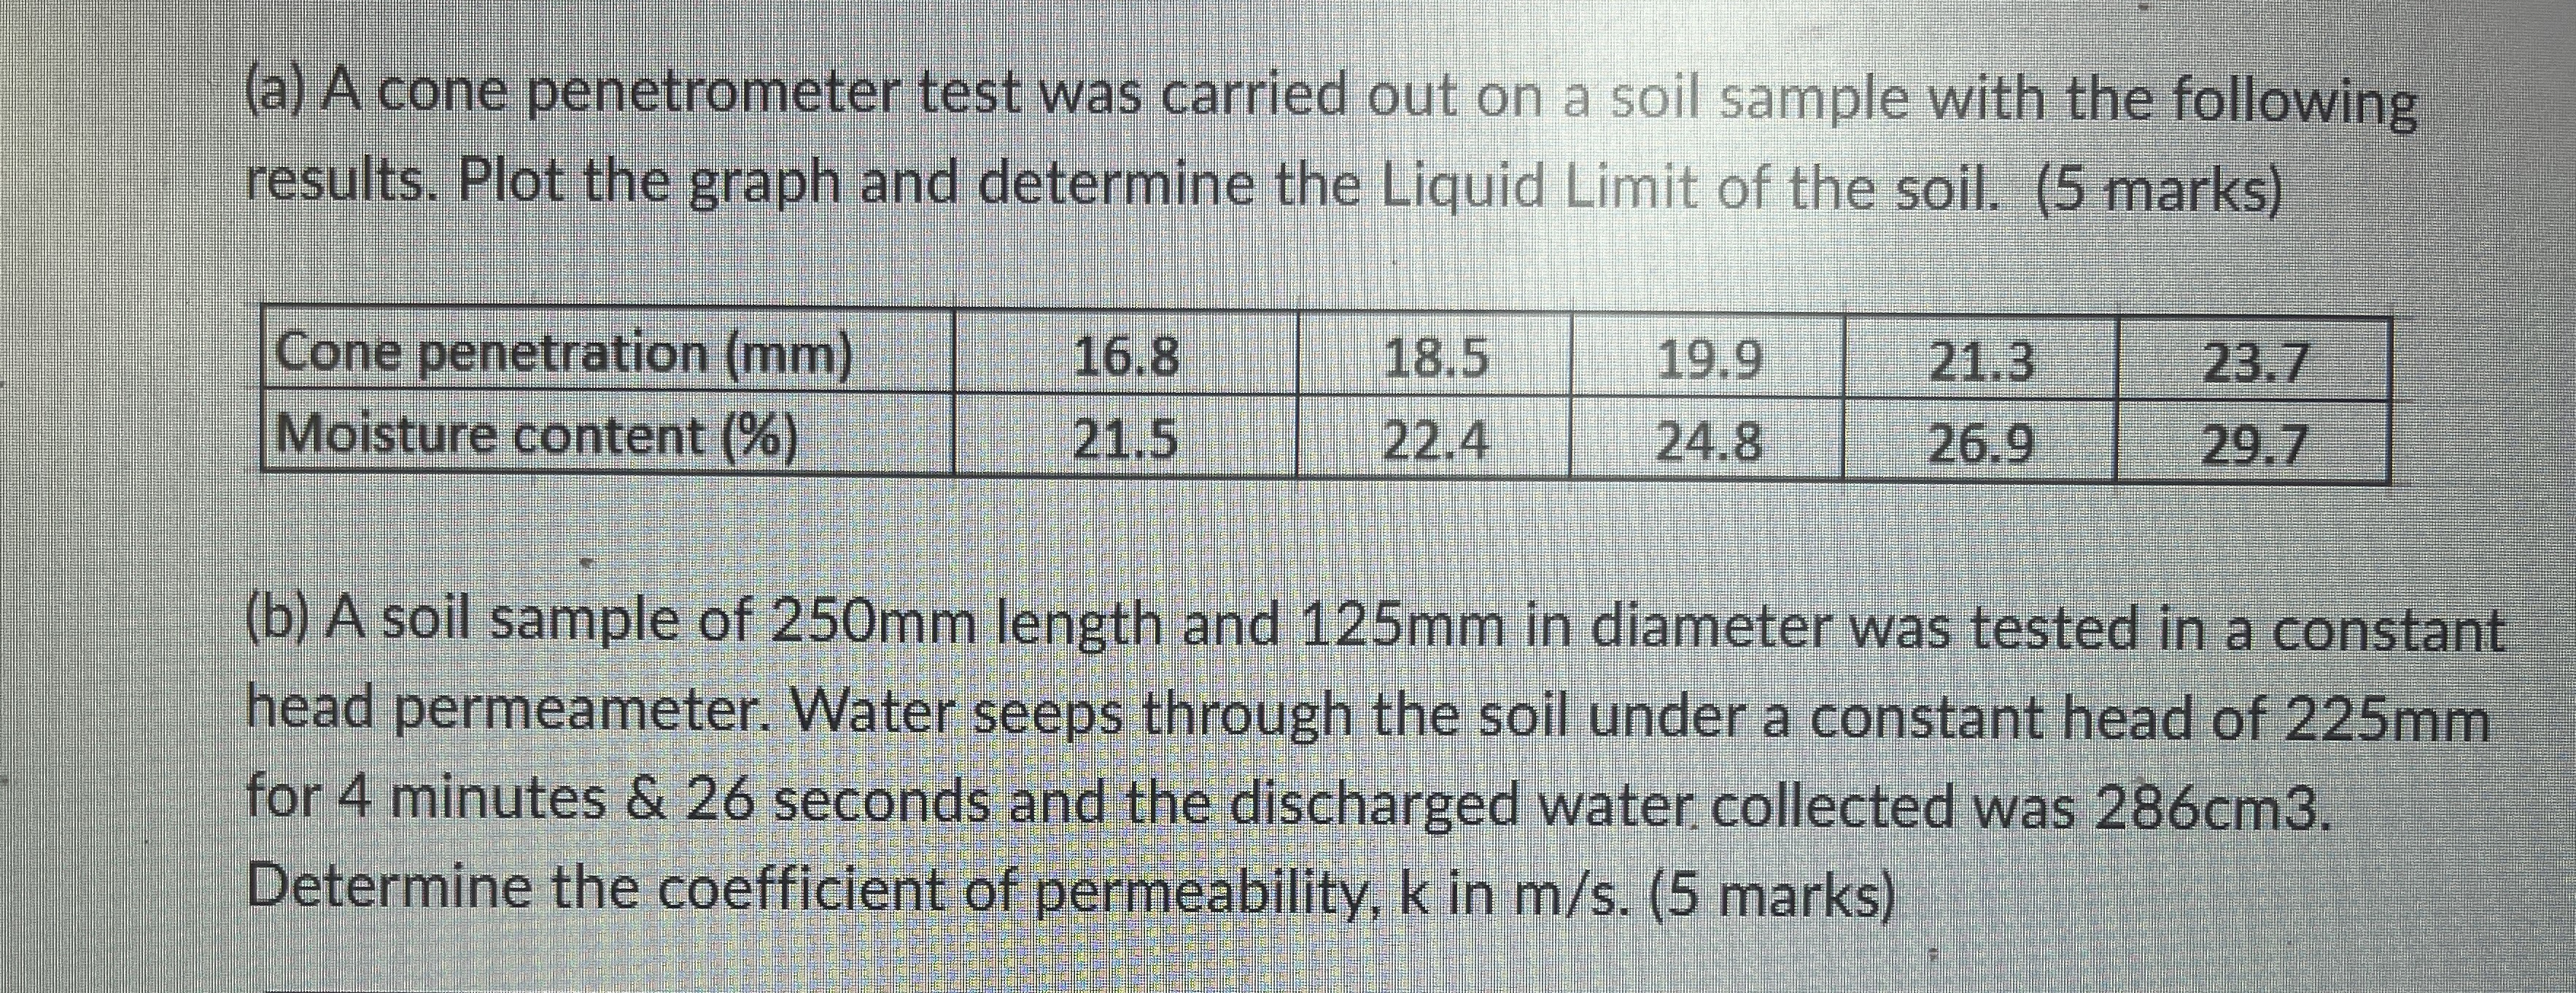
a A cone penetrometer test was carried out on a soil sample with the following results. Plot the graph and determine the Liquid Limit of the soil. marks
tableCone penetration Moisture content
b A soil sample of length and in diameter was tested in a constant head permeameter. Water seeps through the soil under a constant head of for minutes & seconds and the discharged water collected was Determine the coefficient of permeability, in marks
Step by Step Solution
There are 3 Steps involved in it
1 Expert Approved Answer
Step: 1 Unlock

Question Has Been Solved by an Expert!
Get step-by-step solutions from verified subject matter experts
Step: 2 Unlock
Step: 3 Unlock