

Question: A.) Among the four forecasting methods, which model would provide the best forecast for the period from Jan-17 to Sept-18, Why? B.) Use the data
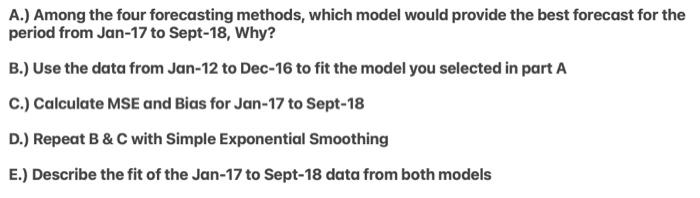
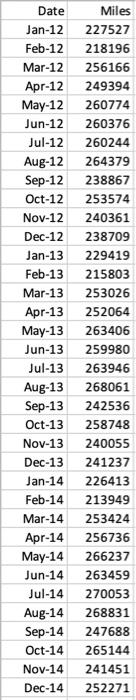
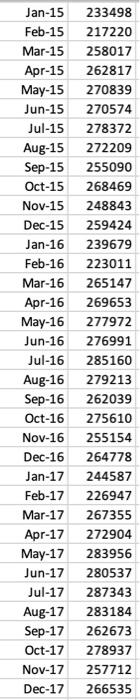
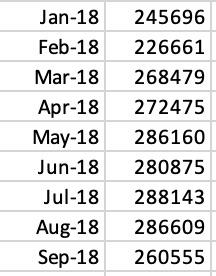
A.) Among the four forecasting methods, which model would provide the best forecast for the period from Jan-17 to Sept-18, Why? B.) Use the data from Jan-12 to Dec-16 to fit the model you selected in part A C.) Calculate MSE and Bias for Jan-17 to Sept-18 D.) Repeat B \& C with Simple Exponential Smoothing E.) Describe the fit of the Jan-17 to Sept-18 data from both models \begin{tabular}{|r|r|} \hline Jan-15 & 233498 \\ \hline Feb-15 & 217220 \\ \hline Mar-15 & 258017 \\ \hline Apr-15 & 262817 \\ \hline May-15 & 270839 \\ \hline Jun-15 & 270574 \\ \hline Jul-15 & 278372 \\ \hline Aug-15 & 272209 \\ \hline Sep-15 & 255090 \\ \hline Oct-15 & 268469 \\ \hline Nov-15 & 248843 \\ \hline Dec-15 & 259424 \\ \hline Jan-16 & 239679 \\ \hline Feb-16 & 223011 \\ \hline Mar-16 & 265147 \\ \hline Apr-16 & 269653 \\ \hline May-16 & 277972 \\ \hline Jun-16 & 276991 \\ \hline Jul-16 & 285160 \\ \hline Aug-16 & 279213 \\ \hline Sep-16 & 262039 \\ \hline Oct-16 & 275610 \\ \hline Nov-16 & 255154 \\ \hline Dec-16 & 264778 \\ \hline Jan-17 & 244587 \\ \hline Feb-17 & 226947 \\ \hline Mar-17 & 267355 \\ \hline Apr-17 & 272904 \\ \hline May-17 & 283956 \\ \hline Jun-17 & 280537 \\ \hline Jul-17 & 287343 \\ \hline Aug-17 & 283184 \\ \hline Sep-17 & 262673 \\ \hline Oct-17 & 278937 \\ \hline Nov-17 & 257712 \\ \hline Dec-17 & 266535 \\ \hline \end{tabular} \begin{tabular}{|r|r|} \hline Jan-18 & 245696 \\ \hline Feb-18 & 226661 \\ \hline Mar-18 & 268479 \\ \hline Apr-18 & 272475 \\ \hline May-18 & 286160 \\ \hline Jun-18 & 280875 \\ \hline Jul-18 & 288143 \\ \hline Aug-18 & 286609 \\ \hline Sep-18 & 260555 \\ \hline \end{tabular} A.) Among the four forecasting methods, which model would provide the best forecast for the period from Jan-17 to Sept-18, Why? B.) Use the data from Jan-12 to Dec-16 to fit the model you selected in part A C.) Calculate MSE and Bias for Jan-17 to Sept-18 D.) Repeat B \& C with Simple Exponential Smoothing E.) Describe the fit of the Jan-17 to Sept-18 data from both models \begin{tabular}{|r|r|} \hline Jan-15 & 233498 \\ \hline Feb-15 & 217220 \\ \hline Mar-15 & 258017 \\ \hline Apr-15 & 262817 \\ \hline May-15 & 270839 \\ \hline Jun-15 & 270574 \\ \hline Jul-15 & 278372 \\ \hline Aug-15 & 272209 \\ \hline Sep-15 & 255090 \\ \hline Oct-15 & 268469 \\ \hline Nov-15 & 248843 \\ \hline Dec-15 & 259424 \\ \hline Jan-16 & 239679 \\ \hline Feb-16 & 223011 \\ \hline Mar-16 & 265147 \\ \hline Apr-16 & 269653 \\ \hline May-16 & 277972 \\ \hline Jun-16 & 276991 \\ \hline Jul-16 & 285160 \\ \hline Aug-16 & 279213 \\ \hline Sep-16 & 262039 \\ \hline Oct-16 & 275610 \\ \hline Nov-16 & 255154 \\ \hline Dec-16 & 264778 \\ \hline Jan-17 & 244587 \\ \hline Feb-17 & 226947 \\ \hline Mar-17 & 267355 \\ \hline Apr-17 & 272904 \\ \hline May-17 & 283956 \\ \hline Jun-17 & 280537 \\ \hline Jul-17 & 287343 \\ \hline Aug-17 & 283184 \\ \hline Sep-17 & 262673 \\ \hline Oct-17 & 278937 \\ \hline Nov-17 & 257712 \\ \hline Dec-17 & 266535 \\ \hline \end{tabular} \begin{tabular}{|r|r|} \hline Jan-18 & 245696 \\ \hline Feb-18 & 226661 \\ \hline Mar-18 & 268479 \\ \hline Apr-18 & 272475 \\ \hline May-18 & 286160 \\ \hline Jun-18 & 280875 \\ \hline Jul-18 & 288143 \\ \hline Aug-18 & 286609 \\ \hline Sep-18 & 260555 \\ \hline \end{tabular}
Step by Step Solution
There are 3 Steps involved in it

Get step-by-step solutions from verified subject matter experts