

Question: A, B, and C must be calculated for both charts indivdually References Mailings Review View Help E ALT 1 Normal 1 No Spac... Heading 1
A, B, and C must be calculated for both charts indivdually
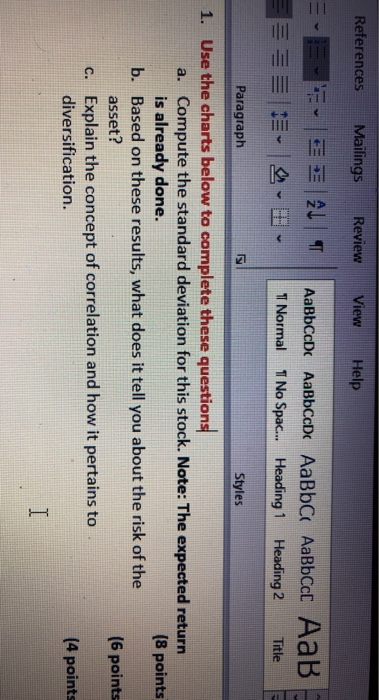
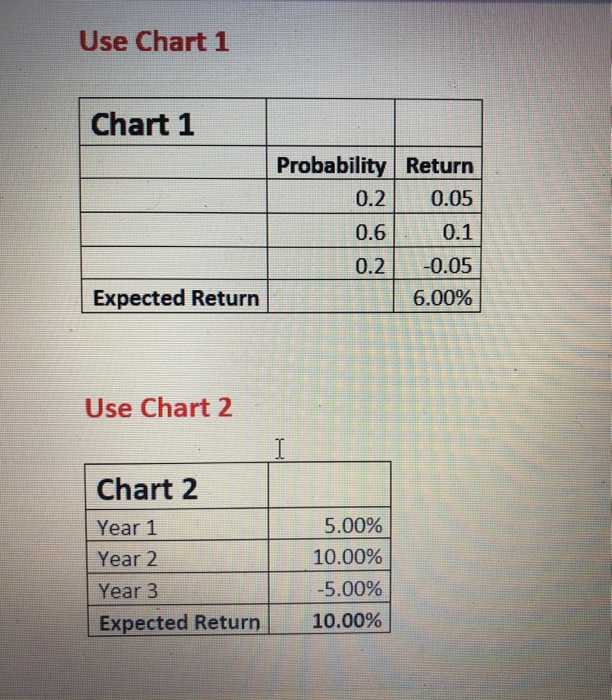
References Mailings Review View Help E ALT 1 Normal 1 No Spac... Heading 1 Heading 2 Title Paragraph Styles 1. Use the charts below to complete these questions a. Compute the standard deviation for this stock. Note: The expected return is already done. (8 points b. Based on these results, what does it tell you about the risk of the asset? (6 points c. Explain the concept of correlation and how it pertains to diversification. (4 points I Use Chart 1 Chart 1 Probability Return 0.2 0.05 0.6 0.1 0.2 -0.05 6.00% Expected Return Use Chart 2 I Chart 2 Year 1 Year 2 5.00% 10.00% -5.00% 10.00% Year 3 Expected Return
Step by Step Solution
There are 3 Steps involved in it
1 Expert Approved Answer
Step: 1 Unlock

Question Has Been Solved by an Expert!
Get step-by-step solutions from verified subject matter experts
Step: 2 Unlock
Step: 3 Unlock