

Question: A B C D E F CALCULATING PORTFOLIO RETURNS 2 Stock A Stock B 3 Mean 8.00% 11.00% 7 Variance 1.71% 2.67% 5 Standard
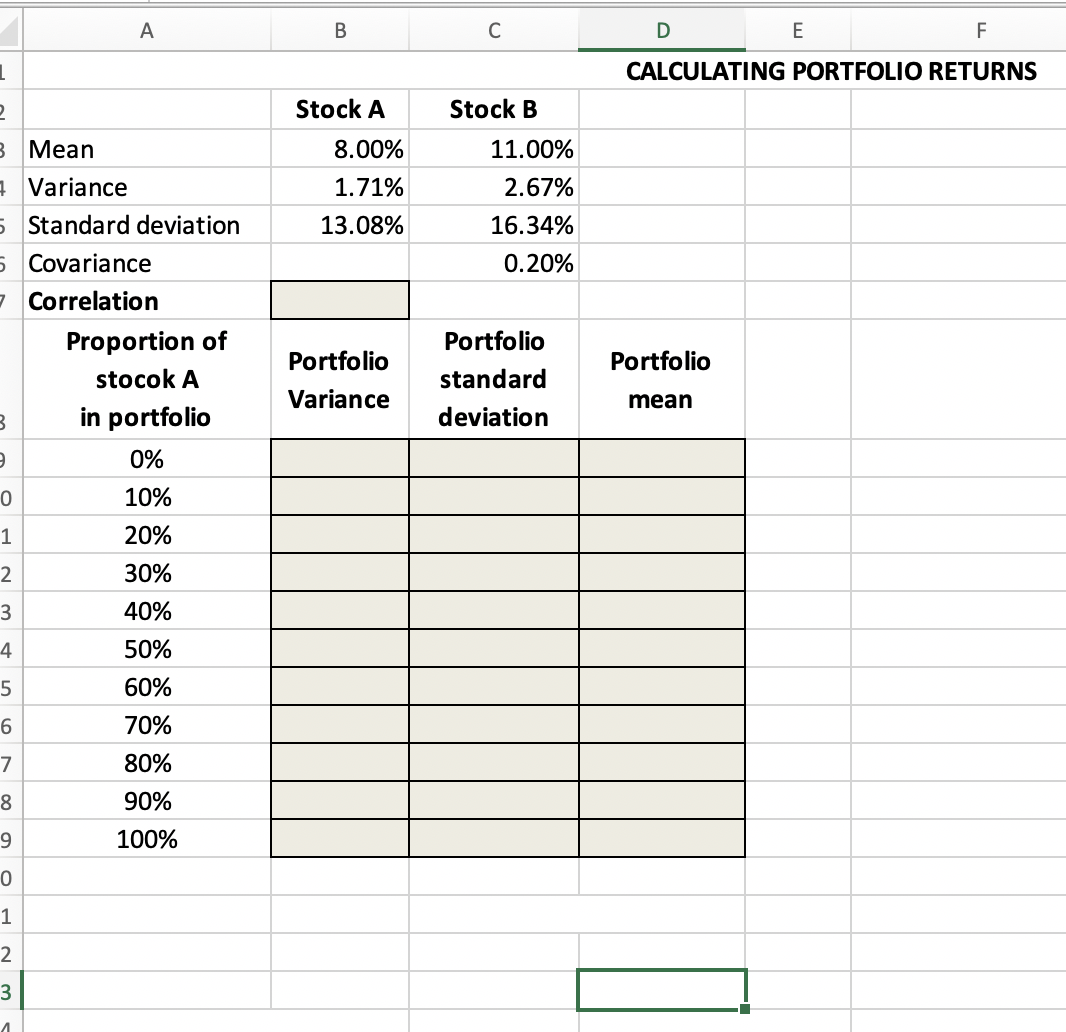
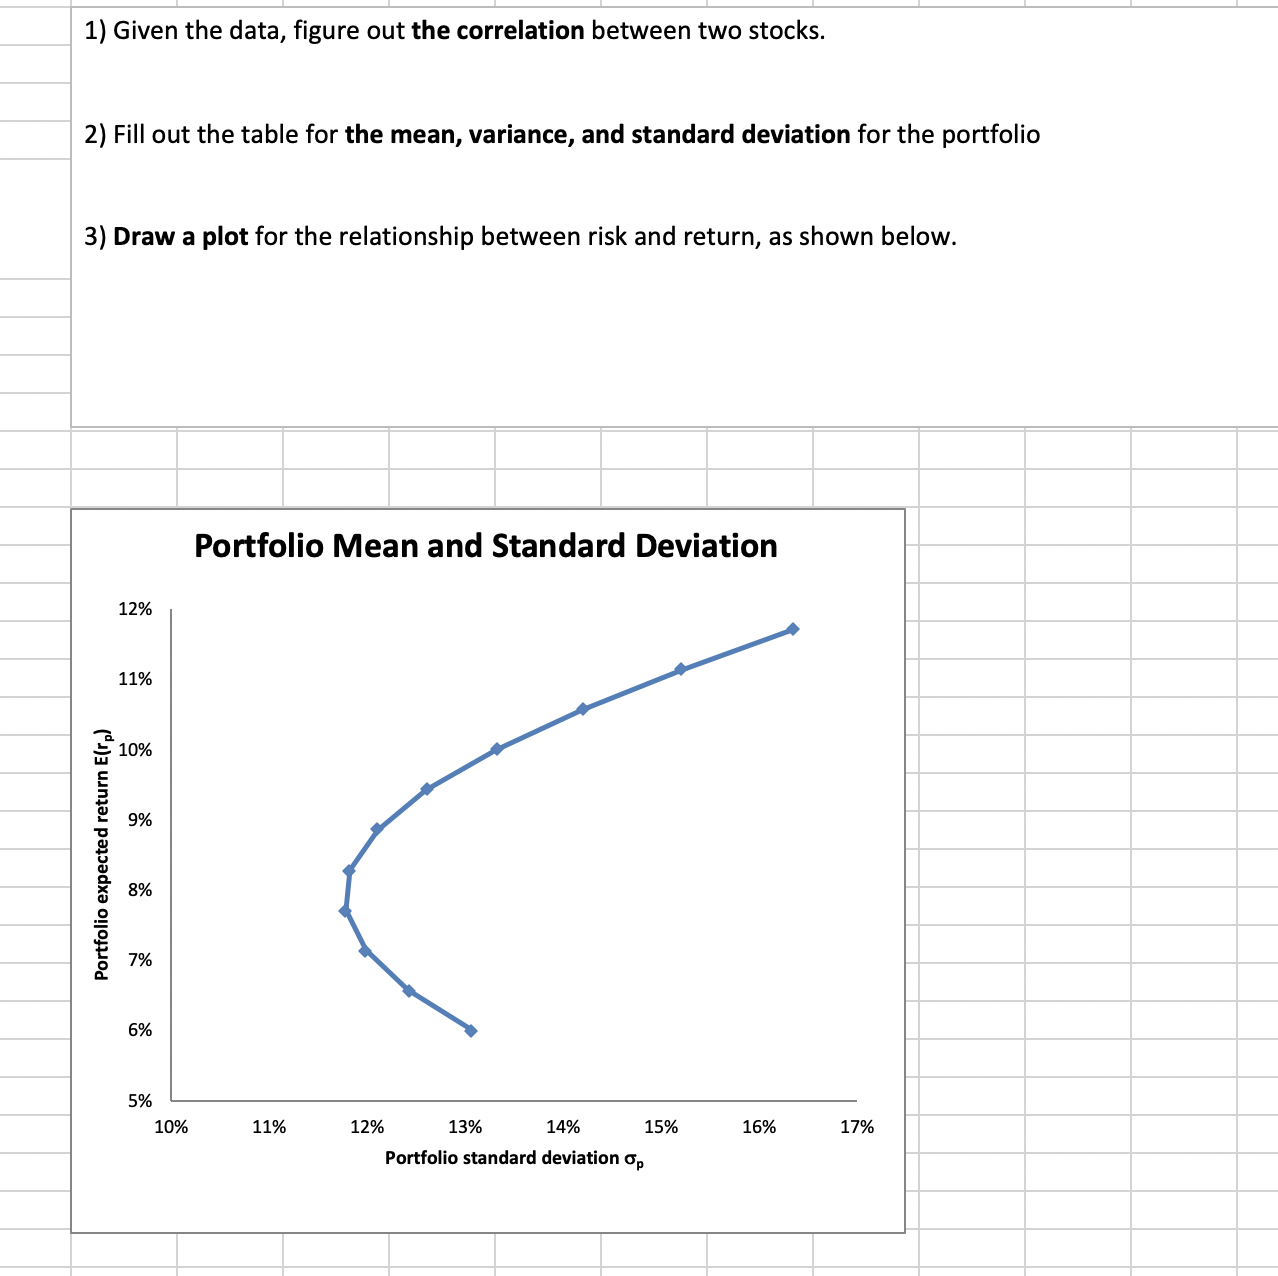
A B C D E F CALCULATING PORTFOLIO RETURNS 2 Stock A Stock B 3 Mean 8.00% 11.00% 7 Variance 1.71% 2.67% 5 Standard deviation 13.08% 16.34% 5 Covariance 0.20% 7 Correlation Proportion of Portfolio Portfolio Portfolio stocok A standard Variance mean B in portfolio deviation 9 0% O123 0 10% 20% 30% 40% 4 50% 5 60% 69 70% 80% 8 90% 9 100% 0 1 2 3 Portfolio expected return E(rp) 1) Given the data, figure out the correlation between two stocks. 2) Fill out the table for the mean, variance, and standard deviation for the portfolio 3) Draw a plot for the relationship between risk and return, as shown below. 12% 11% 10% 9% 8% 7% 6% Portfolio Mean and Standard Deviation 5% 10% 11% 12% 13% 14% 15% 16% 17% Portfolio standard deviation op
Step by Step Solution
There are 3 Steps involved in it

Get step-by-step solutions from verified subject matter experts