

Question: A B C D E F G 155 Copyable H Copyable K L M N Year Month Domestic Seasonal Index way to do Average
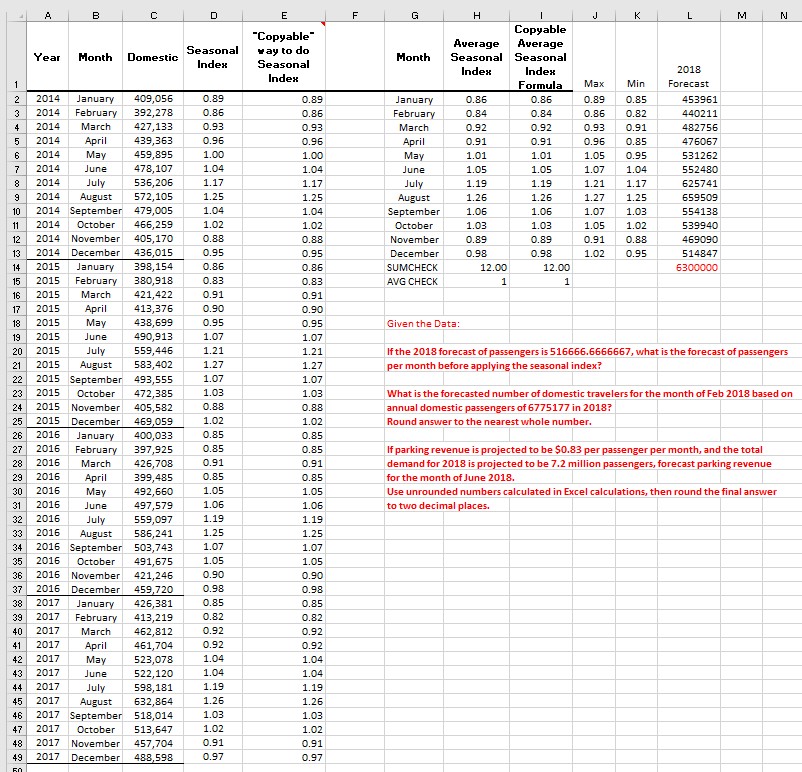
A B C D E F G 155 "Copyable" H Copyable K L M N Year Month Domestic Seasonal Index way to do Average Average Month Seasonal Index Index - Seasonal Seasonal Index Formula 2018 Max Min Forecast 2 2014 January 409,056 0.89 0.89 January 0.86 0.86 0.89 0.85 453961 3 2014 February 392,278 0.86 0.86 February 0.84 0.84 0.86 0.82 440211 4 2014 March 427,133 0.93 0.93 March 0.92 0.92 0.93 0.91 482756 5 2014 April 439,363 0.96 0.96 April 0.91 0.91 0.96 0.85 476067 6 2014 May 459,895 1.00 1.00 May 1.01 1.01 1.05 0.95 531262 7 2014 June 478,107 1.04 1.04 June 1.05 1.05 1.07 1.04 552480 8 2014 July 536,206 1.17 1.17 July 1.19 1.19 1.21 1.17 625741 9 2014 August 572,105 1.25 1.25 August 1.26 1.26 1.27 1.25 659509 10 2014 September 479,005 1.04 1.04 September 1.06 1.06 1.07 1.03 554138 11 2014 October 466,259 1.02 1.02 October 1.03 1.03 1.05 1.02 539940 12 2014 November 405,170 0.88 0.88 November 0.89 0.89 0.91 0.88 469090 13 2014 December 436,015 0.95 0.95 December 0.98 0.98 1.02 0.95 14 2015 January 398,154 0.86 0.86 SUMCHECK 15 2015 February 380,918 0.83 0.83 AVG CHECK 12.00 1 12.00 1 514847 6300000 16 17 2015 2015 March 421,422 0.91 0.91 April 413,376 0.90 0.90 18 2015 May 438,699 0.95 0.95 Given the Data: 19 2015 20 2015 June 490,913 1.07 1.07 July 559,446 1.21 1.21 21 2015 August 583,402 1.27 1.27 22 2015 September 493,555 23 2015 October 472,385 1.07 1.07 1.03 1.03 24 25 2015 November 2015 December 405,582 0.88 0.88 469,059 1.02 1.02 26 2016 January 400,033 0.85 0.85 27 2016 February 397,925 0.85 0.85 28 2016 March 426,708 0.91 0.91 29 2016 April 399,485 0.85 0.85 30 31 2016 2016 32 2016 May 492,660 1.05 1.05 June 497,579 1.06 1.06 If the 2018 forecast of passengers is 516666.6666667, what is the forecast of passengers per month before applying the seasonal index? What is the forecasted number of domestic travelers for the month of Feb 2018 based on annual domestic passengers of 6775177 in 2018? Round answer to the nearest whole number. If parking revenue is projected to be $0.83 per passenger per month, and the total demand for 2018 is projected to be 7.2 million passengers, forecast parking revenue for the month of June 2018. Use unrounded numbers calculated in Excel calculations, then round the final answer to two decimal places. July 559,097 1.19 1.19 33 2016 August 586,241 1.25 1.25 34 2016 September 35 2016 October 503,743 1.07 1.07 491,675 1.05 1.05 36 2016 November 421,246 0.90 0.90 37 2016 December 459,720 0.98 0.98 38 2017 January 426,381 0.85 0.85 39 2017 February 413,219 40 2017 March 41 2017 April 0.82 0.82 462,812 0.92 0.92 461,704 0.92 0.92 42 2017 May 523,078 1.04 1.04 43 44 84 2017 June 522,120 1.04 1.04 2017 July 598,181 1.19 1.19 45 2017 August 632,864 1.26 1.26 46 2017 September 518,014 1.03 1.03 47 2017 October 513,647 1.02 1.02 48 2017 November 457,704 0.91 0.91 49 2017 December 488,598 0.97 0.97 60
Step by Step Solution
There are 3 Steps involved in it

Get step-by-step solutions from verified subject matter experts