

Question: A B C D E F G H I 1 Below are the ratios (with excel formulas) calculated for Pepsi-Co, Inc. for you - all
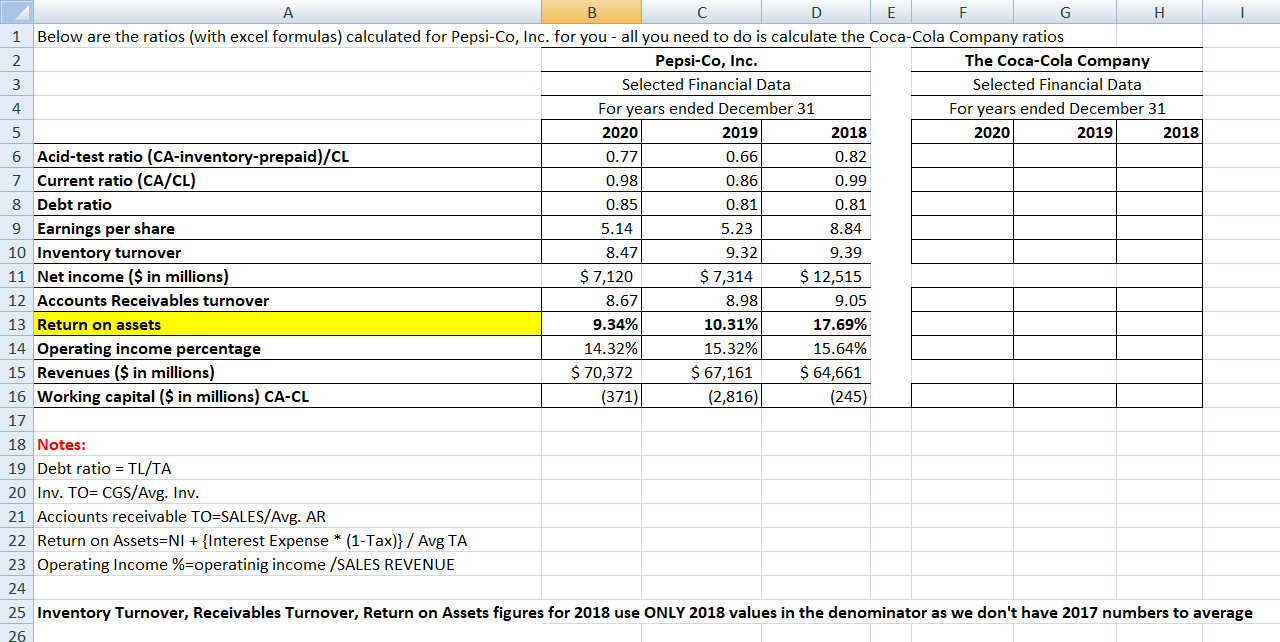
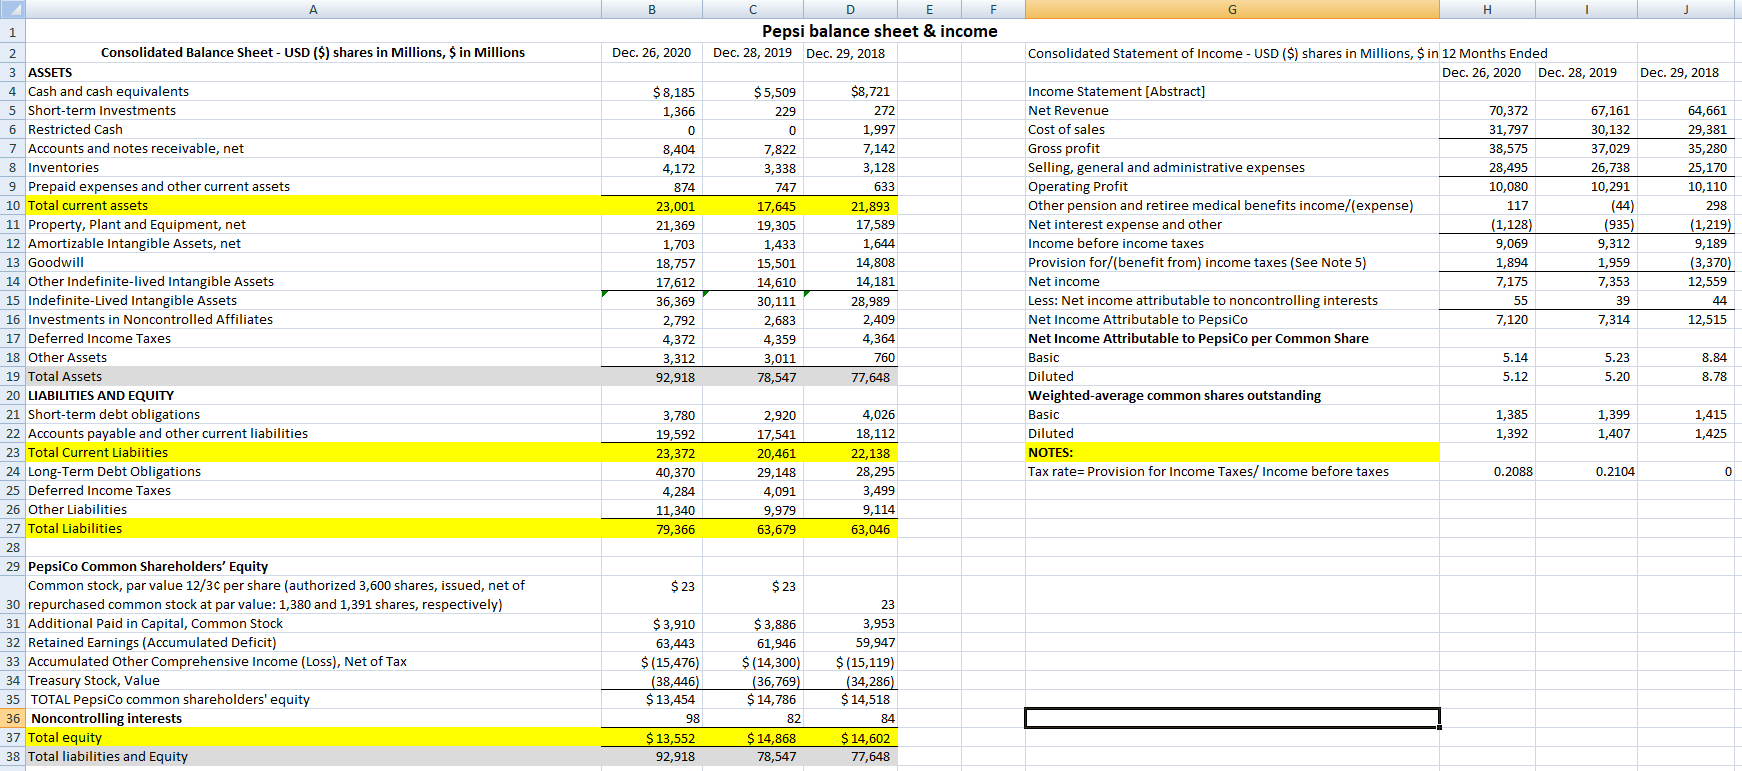

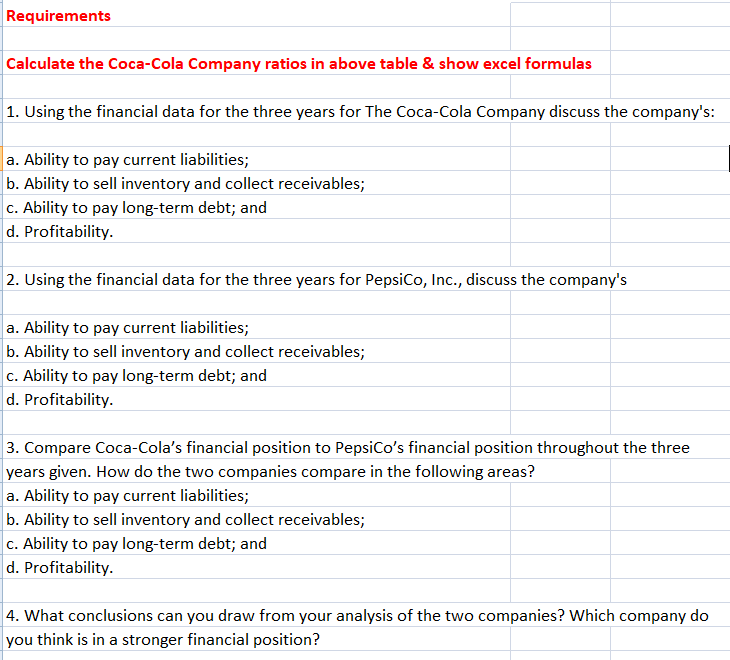
A B C D E F G H I 1 Below are the ratios (with excel formulas) calculated for Pepsi-Co, Inc. for you - all you need to do is calculate the Coca-cola Company ratios 2 Pepsi-Co, Inc. The Coca-Cola Company 3 Selected Financial Data Selected Financial Data 4 For years ended December 31 For years ended December 31 5 2020 2019 2018 2020 2019 2018 6 Acid-test ratio (CA-inventory-prepaid)/CL 0.77 0.66 0.82 7 Current ratio (CA/CL) 0.98 0.86 0.99 8 Debt ratio 0.85 0.81 0.81 9 Earnings per share 5.14 5.23 8.84 10 Inventory turnover 8.47 9.32 9.39 11 Net income ($ in millions) $ 7,120 $ 7,314 $ 12,515 12 Accounts Receivables turnover 8.67 8.98 9.05 13 Return on assets 9.34% 10.31% 17.69% 14 Operating income percentage 14.32% 15.32% 15.64% 15 Revenues ($ in millions) $ 70,372 $ 67,161 $ 64,661 16 Working capital ($ in millions) CA-CL (371) (2,816) (245) 17 18 Notes: 19 Debt ratio = TL/TA 20 Inv. TO= CGS/Avg. Inv. 21 Acciounts receivable TO=SALES/Avg. AR 22 Return on Assets=NI + {Interest Expense * (1-Tax)} / Avg TA 23 Operating Income %=operating income /SALES REVENUE 24 25 Inventory Turnover, Receivables Turnover, Return on Assets figures for 2018 use ONLY 2018 values in the denominator as we don't have 2017 numbers to average 76A B C D E F G H Pepsi balance sheet & income 2 Consolidated Balance Sheet - USD ($) shares in Millions, $ in Millions Dec. 26, 2020 Dec. 28, 2019 Dec. 29, 2018 Consolidated Statement of Income - USD ($) shares in Millions, $ in 12 Months Ended 3 ASSETS Dec. 26, 2020 Dec. 28, 2019 Dec. 29, 2018 Cash and cash equivalents $ 8,185 $ 5,509 $8,721 Income Statement [Abstract] 5 Short-term Investments 1,366 229 272 Net Revenue 70,372 67,161 64,661 6 Restricted Cash 1,997 Cost of sales 31,797 30,132 29,381 7 Accounts and notes receivable, net 8,404 7,822 7,142 Gross profit 38,575 37,029 35,280 8 Inventories 4,172 3,338 3,128 Selling, general and administrative expenses 28,495 26,738 25,170 9 Prepaid expenses and other current assets 874 747 633 Operating Profit 10,080 10,291 10,110 10 Total current assets 23,001 17,645 21,893 Other pension and retiree medical benefits income/(expense) 117 (44) 298 11 Property, Plant and Equipment, net 21,369 19,305 17,589 Net interest expense and other (1,128 (935) (1,219 12 Amortizable Intangible Assets, net 1,703 1,433 1,644 Income before income taxes 9,069 9,312 9,18 13 Goodwill 18,757 15,501 14,808 Provision for/(benefit from) income taxes (See Note 5) 1,894 1,959 (3,370) 14 Other Indefinite-lived Intangible Assets 17,612 14,610 14,181 Net income 7,175 7,353 12,559 15 Indefinite-Lived Intangible Assets 36,369 30,111 28,989 Less: Net income attributable to noncontrolling interests 55 39 44 16 Investments in Noncontrolled Affiliates 2,792 2,683 2,409 Net Income Attributable to PepsiCo 7,120 7,314 12,515 17 Deferred Income Taxes 4,372 4,359 4,364 Net Income Attributable to PepsiCo per Common Share 18 Other Assets 3,312 3.011 760 Basic 5.14 5.23 8.84 19 Total Assets 92,918 78,547 77,648 Diluted 5.12 5.20 8,78 20 LIABILITIES AND EQUITY Weighted-average common shares outstanding 21 Short-term debt obligations 3,780 2,920 4,026 Basic 1,385 1,399 1,415 22 Accounts payable and other current liabilities 19,592 17,541 18,112 Diluted 1,392 1,407 1,425 23 Total Current Liabiities 23,372 20,461 22,138 NOTES: 24 Long-Term Debt Obligations 40,370 29,148 28,295 Tax rate= Provision for Income Taxes/ Income before taxes 0.2088 0.2104 0 25 Deferred Income Taxes 4.284 4,091 3,49 26 Other Liabilities 11,340 9.979 9.114 27 Total Liabilities 79,366 63,679 63,046 28 29 PepsiCo Common Shareholders' Equity Common stock, par value 12/3c per share (authorized 3,600 shares, issued, net of $ 23 $ 23 30 repurchased common stock at par value: 1,380 and 1,391 shares, respectively) 23 31 Additional Paid in Capital, Common Stock $ 3,910 $ 3,886 3,953 32 Retained Earnings (Accumulated Deficit) 63,443 61,946 59,947 33 Accumulated Other Comprehensive Income (Loss), Net of Tax $ (15,476) $ (14,300) $ (15,119 34 Treasury Stock, Value (38,446 (36,769 (34,286) 35 TOTAL PepsiCo common shareholders' equity $ 13,454 $ 14,786 $ 14,518 36 Noncontrolling interests 36 82 84 37 Total equity $ 13,552 $ 14,868 $ 14,602 38 Total liabilities and Equity 92,918 78,547 77,648A B C D E F G H Pepsi balance sheet & income Consolidated Balance Sheet - USD ($) shares in Millions, $ in Millions Dec. 26, 2020 Dec. 28, 2019 Dec. 29, 2018 Consolidated Statement of Income - USD ($) shares in Millions, $ in 12 Months Ended 3 ASSETS Dec. 26, 2020 Dec. 28, 2019 Dec. 29, 2018 Cash and cash equivalents $ 8,185 $ 5,509 $8,721 Income Statement [Abstract] 5 Short-term Investments 1,366 229 272 Net Revenue 70,372 67,161 64,661 6 Restricted Cash 1,997 Cost of sales 31,797 30,132 29,381 7 Accounts and notes receivable, net 8,404 7,822 7,142 Gross profit 38,575 37,029 35,280 8 Inventories 4,172 3,338 3,128 Selling, general and administrative expenses 28,495 26,738 25,170 9 Prepaid expenses and other current assets 874 747 633 Operating Profit 10,080 10,291 10,110 10 Total current assets 23,001 17,645 21,893 Other pension and retiree medical benefits income/( expense) 117 (44) 298 11 Property, Plant and Equipment, net 21,369 19,305 17,589 Net interest expense and other (1,128 (935) (1,219 12 Amortizable Intangible Assets, net 1,703 1,433 1,644 Income before income taxes 9,069 9,312 9,18 13 Goodwill 18,757 15,501 14,808 Provision for/(benefit from) income taxes (See Note 5) 1,894 1,959 (3,370) 14 Other Indefinite-lived Intangible Assets 17,612 14,610 14,181 Net income 7,175 7,353 12,559 15 Indefinite-Lived Intangible Assets 36,369 30,111 28,989 Less: Net income attributable to noncontrolling interests 55 39 44 16 Investments in Noncontrolled Affiliates 2,792 2,683 2,409 Net Income Attributable to PepsiCo 7,120 7,314 12,515 17 Deferred Income Taxes 4,372 4,359 4,364 Net Income Attributable to PepsiCo per Common Share 18 Other Assets 3,312 3,011 760 Basic 5.14 5.23 8.84 19 Total Assets 92,918 78,547 77,648 Diluted 5.12 5.20 8.78 20 LIABILITIES AND EQUITY Weighted-average common shares outstanding 21 Short-term debt obligations 3,780 2,920 4,026 Basic 1,385 1,399 1,415 22 Accounts payable and other current liabilities 19,592 17,541 18,112 Diluted 1,392 1,407 1,425 23 Total Current Liabilities 23,372 20,461 22,138 NOTES: 24 Long-Term Debt Obligations 40,370 29,148 28,295 Tax rate= Provision for Income Taxes/ Income before taxes 0.2088 0.2104 25 Deferred Income Taxes 4,284 4,091 3,499 26 Other Liabilities 11,340 9,979 9,114 27 Total Liabilities 79,366 63,679 63,046 28 PepsiCo Common Shareholders' Equity Common stock, par value 12/3c per share (authorized 3,600 shares, issued, net of $ 23 $ 23 30 repurchased common stock at par value: 1,380 and 1,391 shares, respectively) 23 31 Additional Paid in Capital, Common Stock $ 3,910 $ 3,886 3,953 32 Retained Earnings (Accumulated Deficit) 63,443 61,946 59,947 33 Accumulated Other Comprehensive Income (Loss), Net of Tax $ (15,476) $ (14,300) $ (15,119) 34 Treasury Stock, Value (38,446) (36,769) (34,286) 35 TOTAL PepsiCo common shareholders' equity $ 13,454 $ 14,786 $ 14,518 36 Noncontrolling interests 98 82 34 37 Total equity $ 13,552 $ 14,868 $ 14,602 38 Total liabilities and Equity 92,918 78,547 77,648Requirements Calculate the Coca-Cola Company ratios in above table 3|. show excel formulas 1. Using the financial data for the three years for The CocaCola Company discuss the company's: . Ability to pay current liabilities; a b. Ability to sell inventory and collect receiyables; c. Ability to pay long-term debt; and d. Profitability. 2. Using the financial data for the three years for PepsiCo; Inc.; discuss the company's . Ability to pay current liabilities; a b. Ability to sell inventory and collect receiyables; c. Ability to pay longterm debt; and d. Profitability. 3. Compare CocaCola's financial position to PepsiCo's financial position throughout the three years giyen. How do the two companies compare in the following areas? a. Ability to pay current liabilities; b. Ability to sell inyentory and collect receiyables; c. Ability to pay longterm debt; and d. Profitability. 4. 1|\"I'll'hat conclusions can you draw from your analysis of the two companies? 1|Which company do you think is in a stronger financial position
Step by Step Solution
There are 3 Steps involved in it

Get step-by-step solutions from verified subject matter experts