

Question: hos Select Font Paragraph Styles Editing Voice Sensitivity Ed a) Using the data from WRDS, students must fill in the two tables below. All ratios
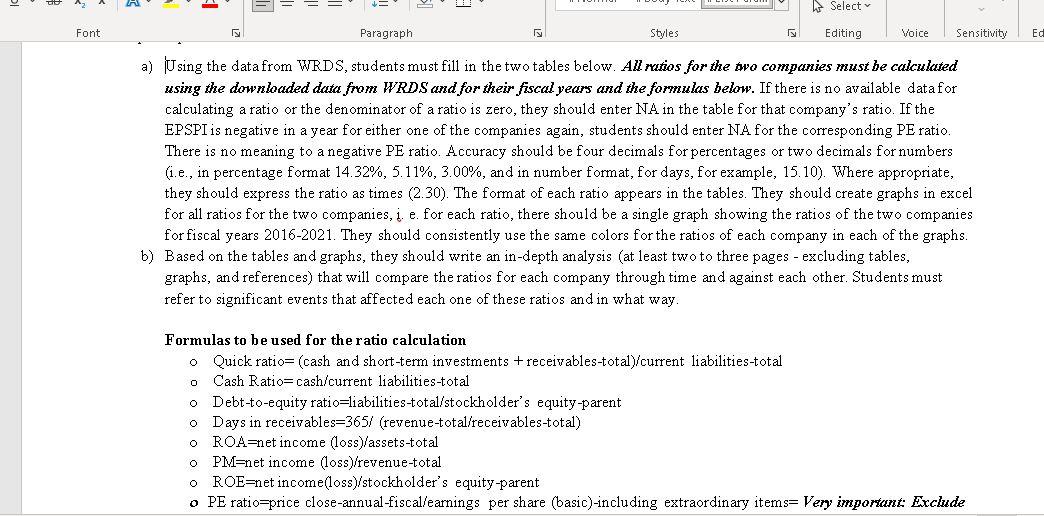
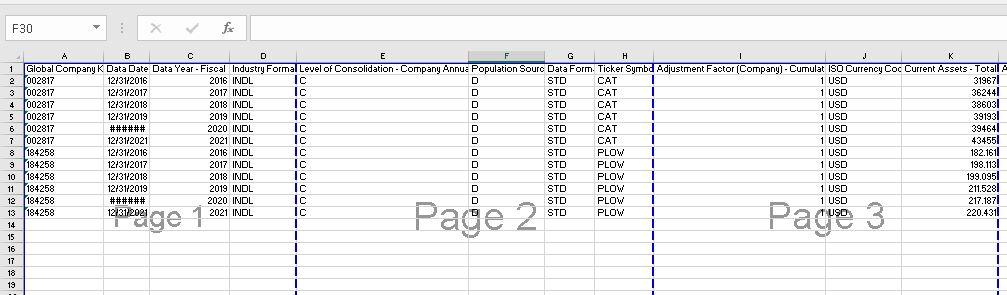
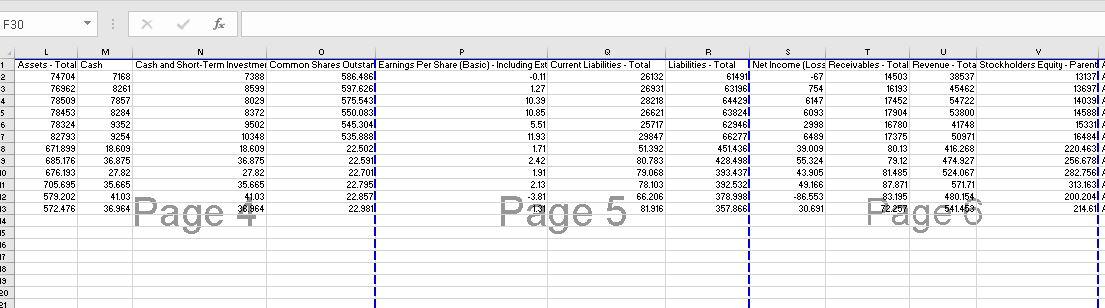
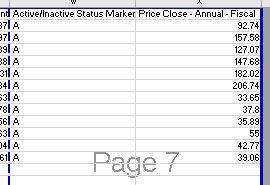
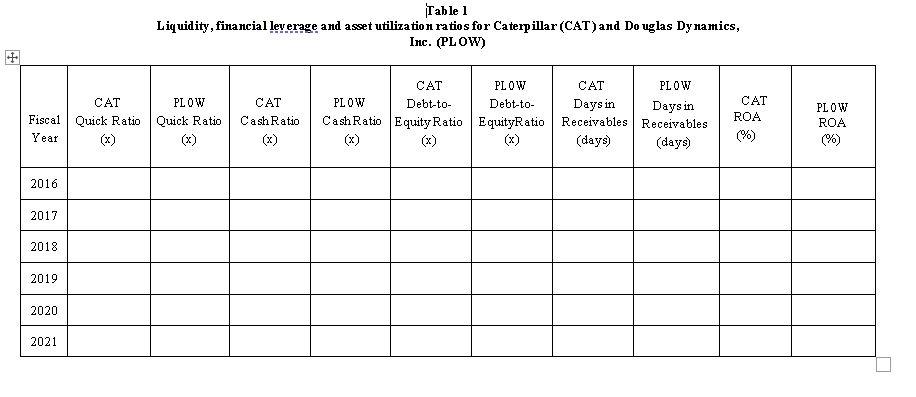
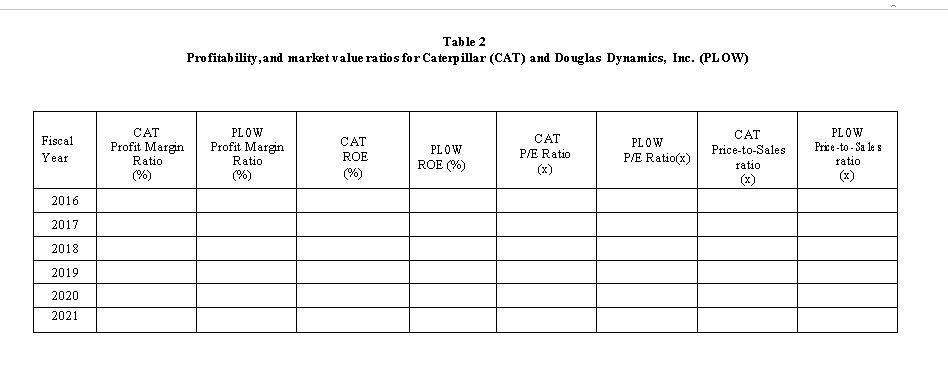
hos Select Font Paragraph Styles Editing Voice Sensitivity Ed a) Using the data from WRDS, students must fill in the two tables below. All ratios for the wo companies must be calculated using the downloaded data from WRDS and for their fiscal years and the formulas below. If there is no available data for calculating a ratio or the denominator of a ratio is zero, they should enter NA in the table for that company's ratio. If the EPSPI is negative in a year for either one of the companies again, students should enter NA for the corresponding PE ratio. There is no meaning to a negative PE ratio. Accuracy should be four decimals for percentages or two decimals for numbers (i.e., in percentage format 14.32%, 5.11%, 3.00%, and in number format, for days, for example, 15.10). Where appropriate, they should express the ratio as times (2.30). The format of each ratio appears in the tables. They should create graphs in excel for all ratios for the two companies, . e. for each ratio, there should be a single graph showing the ratios of the two companies for fiscal years 2016-2021. They should consistently use the same colors for the ratios of each company in each of the graphs b) Based on the tables and graphs, they should write an in-depth analysis (at least two to three pages - excluding tables, graphs, and references) that will compare the ratios for each company through time and against each other. Students must refer to significant events that affected each one of these ratios and in what way. O Formulas to be used for the ratio calculation o Quick ratio=(cash and short-term investments +receivables-total)/current liabilities-total Cash Ratio=cash/current liabilities-total Debt-to-equity ratio=liabilities-total/stockholder's equity-parent O Days in receivables=3657 (revenue-total/receivables-total) O ROA=net income (loss)/assets-total 0 PM=net income (loss)/revenue-total O ROE=net income(loss)/stockholder's equity-parent O PE ratio=price close-annual-fiscal/earnings per share (basic)-including extraordinary items= Very important Exclude F30 f J IC = = - B c D E F G H K 1 1 Global Company K Data Date Data Year - Fiscal Industry Formal Level of Consolidation - Company Annu: Population Sourc Data Form. Ticker Symbd Adjustment Factor (Company) - Cumulat ISO Currency Coc Current Assets - Totall 2 002817 12/31/2016 2016 INDL Ic D STD CAT 1 USD 31967) 3 002817 12/31/2017 2017 INDL STD CAT 1 USD 362441 4002817 12/31/2018 2018 INDL Ic STD CAT 1 1 USD 386031 5 002817 12/31/2019 2019 INDU Ic D STD CAT I 1 USD 6 002817 391931 ###### 2020 INDL Ic D STD CAT 1 1 USD 394641 7 002817 12/31/2021 2021 INDL Ic D STD CAT 1 USD 434551 8 184258 12/31/2016 2016 INDL Ic D STO PLOW 1 USD 9 184258 12/31/2017 182.1611 2017 INDL Ic D STD PLOW 1 USD 198,113 10 184258 12/31/2018 2018 INDL Ic D STD PLOW 1 USD 11 184258 199.0951 12/31/2019 2019 INDL Ic D STD PLOW 1 USD 211.5281 12 184258 ###### 2020 INDL IC STD PLOW 1 USD 217.187! 13 184258 12/31/2021 2021 INDL Ic STD PLOW 220.4311 1 Page 2 Page 3 I 19 F30 : for L M N 0 P Q 1 Assets - Total Cash Cash and Short-Term Investmel Common Shares Outstar. Earnings Per Share (Basic) - Including Ext Current Liabilities - Total 2 74704 7168 7388 586.4861 -0.11 26132 3 76962 8261 8599 597.6261 1.27 26931 4 78509 7857 8029 575.5431 10.39 28219 5 78453 8284 8372 550.083) 10.85 26621 6 78324 9352 9502 545.3041 5.51 25717 7 82793 9254 10348 535.8881 11.93 29847 8 671.899 18.609 18.609 22.5021 1.71 51.392 9 685.176 36.875 36.875 22.5911 2.42 80.783 10 676.193 27.82 27.82 22.7011 1.91 79.068 11 705.695 35.665 35.665 22.7951 2.13 78.103 12 579.202 41.03 41.03 22.857 -3.81 66.206 13 572.476 36.964 36,964 22.9811 81.916 14 T I 15 1 16 I 17 18 1 19 20 21 B $ T U Liabilities - Total TNet Income (Loss Receivables - Total Revenue - Tota Stockholders Equity - Parent 614911 -67 14503 38537 131371 631961 754 16193 45462 136971 644291 6147 17452 54722 140391 638241 6093 17904 53800 145881 629461 2998 16780 41748 153311 662771 6489 17375 50971 164841 451.4361 39.009 80.13 416.268 220.4631 428.4981 55.324 79.12 474.927 256.6781 393.4371 43.905 81.485 524.067 282.7561 392.5321 49.166 87.871 571.71 313.1631 378.9981 -86.553 83.195 480.154 200 2041 357.8661 30.691 541.453 214.611 1 Page 72.25 Pge 5 nd Active/Inactive Status Marker Price Close - Annual - Fiscal 71 A 92.74 271 A 157.58 SIA 127.07 38 A 147.68 311 A 182.02 341 A 206.74 31 A 33.65 37.8 35.89 S3A 55 41 A 42.77 39.06 -81 A 561A SA Page 7 Table 1 Liquidity, financial leverage and asset utilization ratios for Caterpillar (CAT) and Do uglas Dynamics, Inc. (PLOW) CAT PLOW Fiscal Quick Ratio Quick Ratio Year CAT Cash Ratio CAT PLOW PLOW Debt-to- Debt-to- Cash Ratio Equity Ratio EquityRatio (x) CAT PLOW Days in Days in Receivables Receivables (days) (days) CAT ROA PLOW ROA (%) 2016 2017 2018 2019 2020 2021 Table 2 Profitability, and market value ratios for Caterpillar (CAT) and Douglas Dynamics, Inc. (PLOW) Fiscal Year CAT Profit Margin Ratio (%) PLOW Profit Margin Ratio (%) CAT ROE (%) PLOW ROE (%) CAT P/E Ratio PLOW P/E Ratio) CAT Price-to-Sales ratio PLOW Prie-to-Sa les ratio (x) 2016 2017 2018 2019 2020 2021 hos Select Font Paragraph Styles Editing Voice Sensitivity Ed a) Using the data from WRDS, students must fill in the two tables below. All ratios for the wo companies must be calculated using the downloaded data from WRDS and for their fiscal years and the formulas below. If there is no available data for calculating a ratio or the denominator of a ratio is zero, they should enter NA in the table for that company's ratio. If the EPSPI is negative in a year for either one of the companies again, students should enter NA for the corresponding PE ratio. There is no meaning to a negative PE ratio. Accuracy should be four decimals for percentages or two decimals for numbers (i.e., in percentage format 14.32%, 5.11%, 3.00%, and in number format, for days, for example, 15.10). Where appropriate, they should express the ratio as times (2.30). The format of each ratio appears in the tables. They should create graphs in excel for all ratios for the two companies, . e. for each ratio, there should be a single graph showing the ratios of the two companies for fiscal years 2016-2021. They should consistently use the same colors for the ratios of each company in each of the graphs b) Based on the tables and graphs, they should write an in-depth analysis (at least two to three pages - excluding tables, graphs, and references) that will compare the ratios for each company through time and against each other. Students must refer to significant events that affected each one of these ratios and in what way. O Formulas to be used for the ratio calculation o Quick ratio=(cash and short-term investments +receivables-total)/current liabilities-total Cash Ratio=cash/current liabilities-total Debt-to-equity ratio=liabilities-total/stockholder's equity-parent O Days in receivables=3657 (revenue-total/receivables-total) O ROA=net income (loss)/assets-total 0 PM=net income (loss)/revenue-total O ROE=net income(loss)/stockholder's equity-parent O PE ratio=price close-annual-fiscal/earnings per share (basic)-including extraordinary items= Very important Exclude F30 f J IC = = - B c D E F G H K 1 1 Global Company K Data Date Data Year - Fiscal Industry Formal Level of Consolidation - Company Annu: Population Sourc Data Form. Ticker Symbd Adjustment Factor (Company) - Cumulat ISO Currency Coc Current Assets - Totall 2 002817 12/31/2016 2016 INDL Ic D STD CAT 1 USD 31967) 3 002817 12/31/2017 2017 INDL STD CAT 1 USD 362441 4002817 12/31/2018 2018 INDL Ic STD CAT 1 1 USD 386031 5 002817 12/31/2019 2019 INDU Ic D STD CAT I 1 USD 6 002817 391931 ###### 2020 INDL Ic D STD CAT 1 1 USD 394641 7 002817 12/31/2021 2021 INDL Ic D STD CAT 1 USD 434551 8 184258 12/31/2016 2016 INDL Ic D STO PLOW 1 USD 9 184258 12/31/2017 182.1611 2017 INDL Ic D STD PLOW 1 USD 198,113 10 184258 12/31/2018 2018 INDL Ic D STD PLOW 1 USD 11 184258 199.0951 12/31/2019 2019 INDL Ic D STD PLOW 1 USD 211.5281 12 184258 ###### 2020 INDL IC STD PLOW 1 USD 217.187! 13 184258 12/31/2021 2021 INDL Ic STD PLOW 220.4311 1 Page 2 Page 3 I 19 F30 : for L M N 0 P Q 1 Assets - Total Cash Cash and Short-Term Investmel Common Shares Outstar. Earnings Per Share (Basic) - Including Ext Current Liabilities - Total 2 74704 7168 7388 586.4861 -0.11 26132 3 76962 8261 8599 597.6261 1.27 26931 4 78509 7857 8029 575.5431 10.39 28219 5 78453 8284 8372 550.083) 10.85 26621 6 78324 9352 9502 545.3041 5.51 25717 7 82793 9254 10348 535.8881 11.93 29847 8 671.899 18.609 18.609 22.5021 1.71 51.392 9 685.176 36.875 36.875 22.5911 2.42 80.783 10 676.193 27.82 27.82 22.7011 1.91 79.068 11 705.695 35.665 35.665 22.7951 2.13 78.103 12 579.202 41.03 41.03 22.857 -3.81 66.206 13 572.476 36.964 36,964 22.9811 81.916 14 T I 15 1 16 I 17 18 1 19 20 21 B $ T U Liabilities - Total TNet Income (Loss Receivables - Total Revenue - Tota Stockholders Equity - Parent 614911 -67 14503 38537 131371 631961 754 16193 45462 136971 644291 6147 17452 54722 140391 638241 6093 17904 53800 145881 629461 2998 16780 41748 153311 662771 6489 17375 50971 164841 451.4361 39.009 80.13 416.268 220.4631 428.4981 55.324 79.12 474.927 256.6781 393.4371 43.905 81.485 524.067 282.7561 392.5321 49.166 87.871 571.71 313.1631 378.9981 -86.553 83.195 480.154 200 2041 357.8661 30.691 541.453 214.611 1 Page 72.25 Pge 5 nd Active/Inactive Status Marker Price Close - Annual - Fiscal 71 A 92.74 271 A 157.58 SIA 127.07 38 A 147.68 311 A 182.02 341 A 206.74 31 A 33.65 37.8 35.89 S3A 55 41 A 42.77 39.06 -81 A 561A SA Page 7 Table 1 Liquidity, financial leverage and asset utilization ratios for Caterpillar (CAT) and Do uglas Dynamics, Inc. (PLOW) CAT PLOW Fiscal Quick Ratio Quick Ratio Year CAT Cash Ratio CAT PLOW PLOW Debt-to- Debt-to- Cash Ratio Equity Ratio EquityRatio (x) CAT PLOW Days in Days in Receivables Receivables (days) (days) CAT ROA PLOW ROA (%) 2016 2017 2018 2019 2020 2021 Table 2 Profitability, and market value ratios for Caterpillar (CAT) and Douglas Dynamics, Inc. (PLOW) Fiscal Year CAT Profit Margin Ratio (%) PLOW Profit Margin Ratio (%) CAT ROE (%) PLOW ROE (%) CAT P/E Ratio PLOW P/E Ratio) CAT Price-to-Sales ratio PLOW Prie-to-Sa les ratio (x) 2016 2017 2018 2019 2020 2021
Step by Step Solution
There are 3 Steps involved in it

Get step-by-step solutions from verified subject matter experts