Question: A B C D E F G H I L M Quarterly Revenue for Whirlpool Corporation, 1999-2004 (millions of dollars) Year 1999 Qtr1 Qtr2 Qtr3
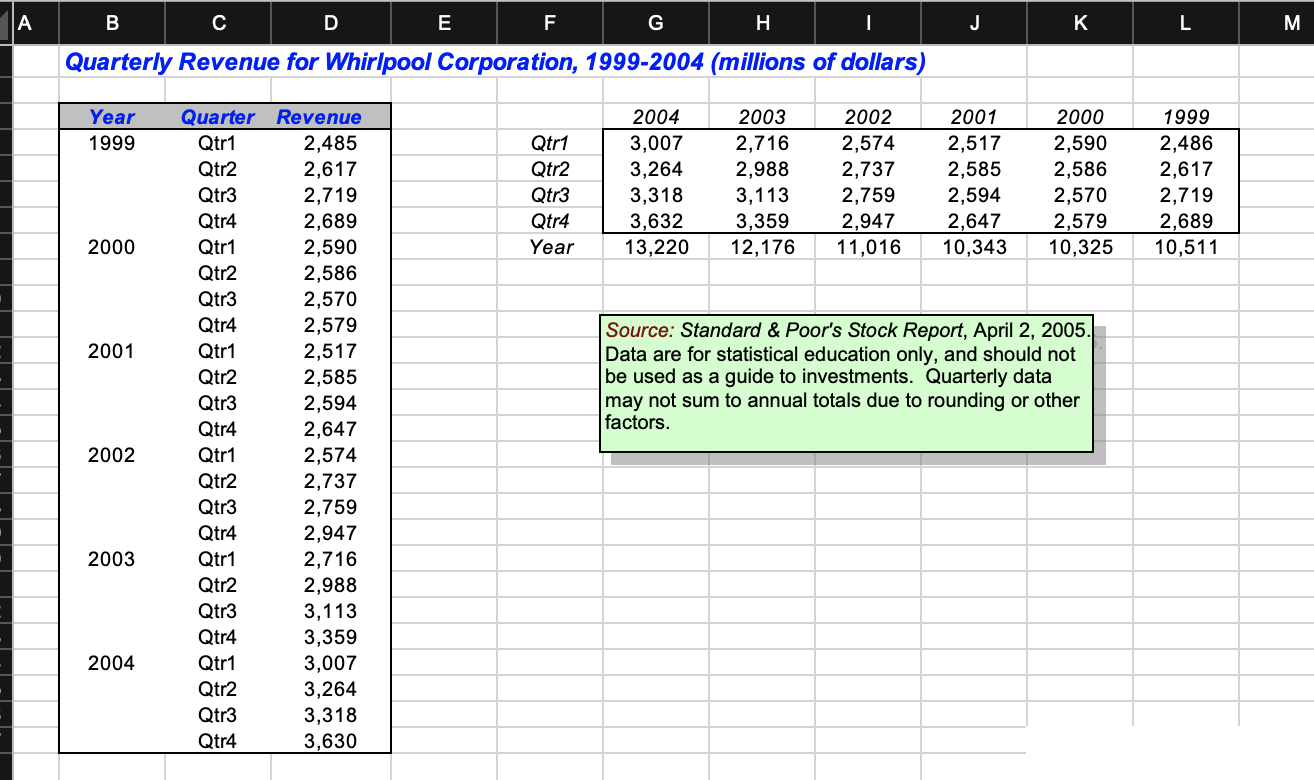
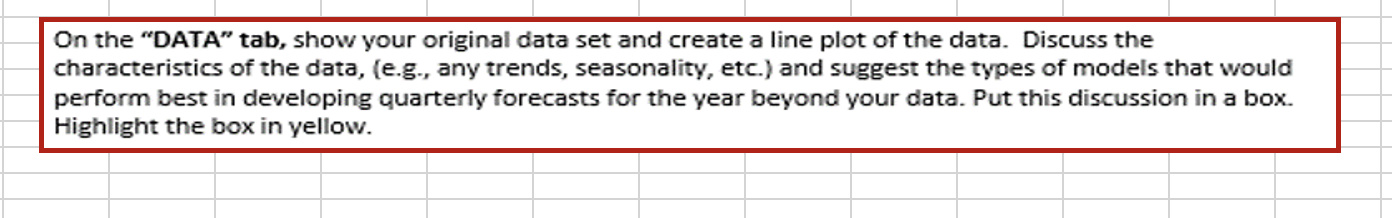
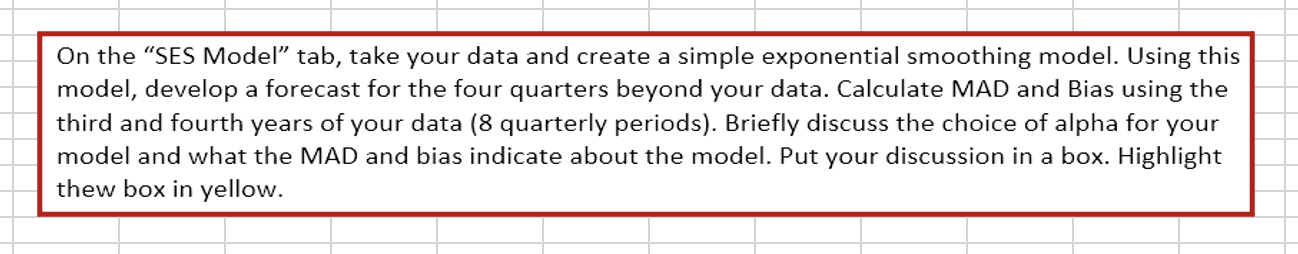
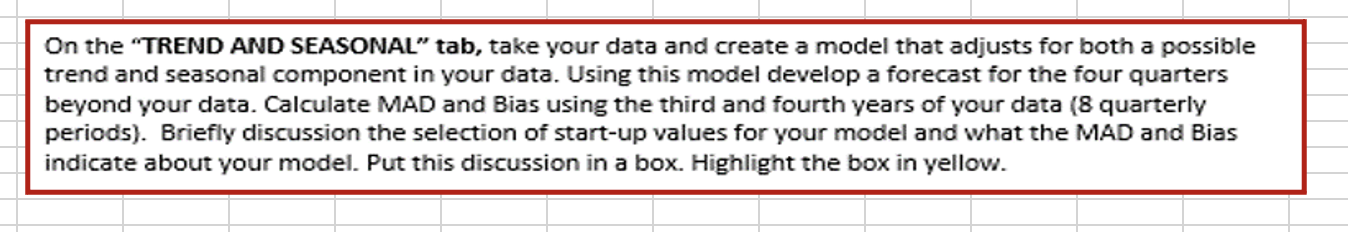
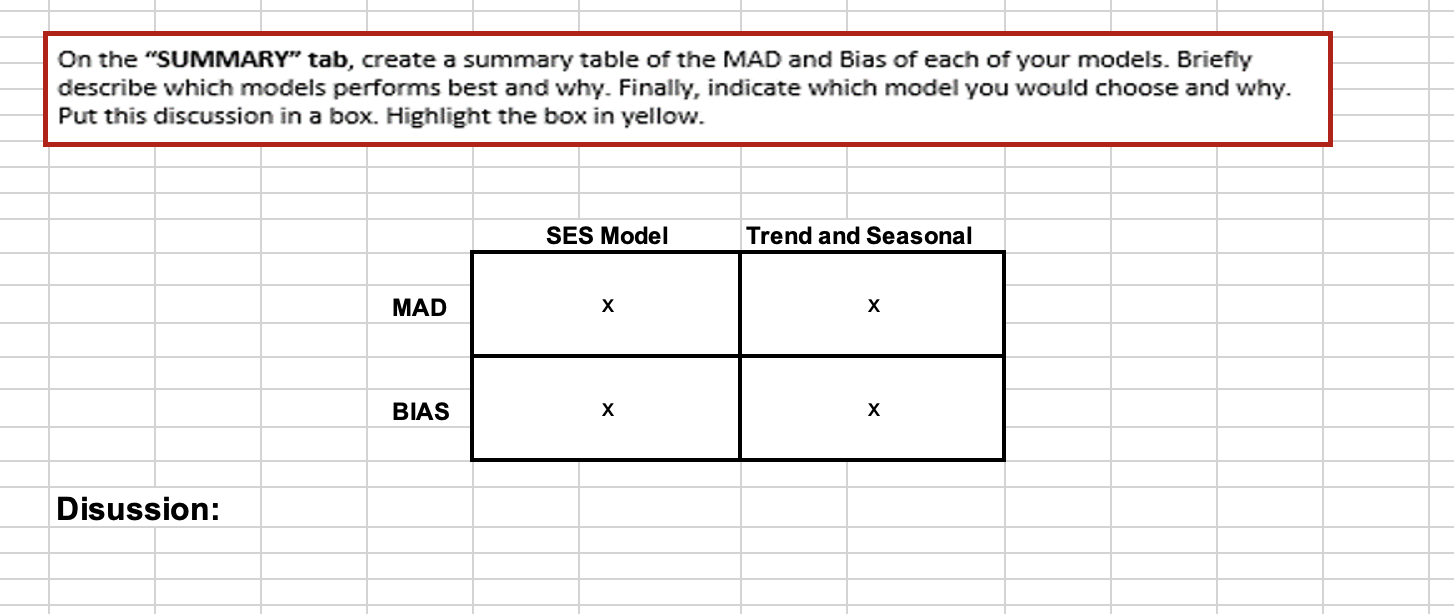
A B C D E F G H I L M Quarterly Revenue for Whirlpool Corporation, 1999-2004 (millions of dollars) Year 1999 Qtr1 Qtr2 Qtr3 Qtr4 Year 2004 3,007 3,264 3,318 3,632 13,220 2003 2,716 2,988 3,113 3,359 12,176 2002 2,574 2,737 2,759 2,947 11,016 2001 2,517 2,585 2,594 2,647 10,343 2000 2,590 2,586 2,570 2,579 10,325 1999 2,486 2,617 2,719 2,689 10,511 2000 2001 Quarter Qtr1 Qtr2 Qtr3 Qtr4 Qtr1 Qtr2 Qtr3 Qtr4 Qtr1 Qtr2 Qtr3 Qtr4 Qtr1 Qtr2 Qtr3 Qtr4 Qtr1 Qtr2 Qtr3 Qtr4 Qtr1 Qtr2 Qtr3 Qtr4 Revenue 2,485 2,617 2,719 2,689 2,590 2,586 2,570 2,579 2,517 2,585 2,594 2,647 2,574 2,737 2,759 2,947 2,716 2,988 3,113 3,359 3,007 3,264 3,318 3,630 Source: Standard & Poor's Stock Report, April 2, 2005. Data are for statistical education only, and should not be used as a guide to investments. Quarterly data may not sum to annual totals due to rounding or other factors. 2002 2003 2004 a On the "DATA" tab, show your original data set and create a line plot of the data. Discuss the characteristics of the data, (e.g., any trends, seasonality, etc.) and suggest the types of models that would perform best in developing quarterly forecasts for the year beyond your data. Put this discussion in a box. Highlight the box in yellow. On the "SES Model tab, take your data and create a simple exponential smoothing model. Using this model, develop a forecast for the four quarters beyond your data. Calculate MAD and Bias using the third and fourth years of your data (8 quarterly periods). Briefly discuss the choice of alpha for your model and what the MAD and bias indicate about the model. Put your discussion in a box. Highlight thew box in yellow. On the "TREND AND SEASONAL" tab, take your data and create a model that adjusts for both a possible trend and seasonal component in your data. Using this model develop a forecast for the four quarters beyond your data. Calculate MAD and Bias using the third and fourth years of your data (8 quarterly periods). Briefly discussion the selection of start-up values for your model and what the MAD and Bias indicate about your model. Put this discussion in a box. Highlight the box in yellow. On the "SUMMARY" tab, create a summary table of the MAD and Bias of each of your models. Briefly describe which models performs best and why. Finally, indicate which model you would choose and why. Put this discussion in a box. Highlight the box in yellow. SES Model Trend and Seasonal MAD BIAS Disussion


