Question: Select Data 1.0 DATA 2.0 SES Model 3.0 Trend and Seasonal Model 4.0 Summary Quarterly Revenue for Whirlpool Corporation, 1999-2004 (millions of dollars) Quarterly Revenue
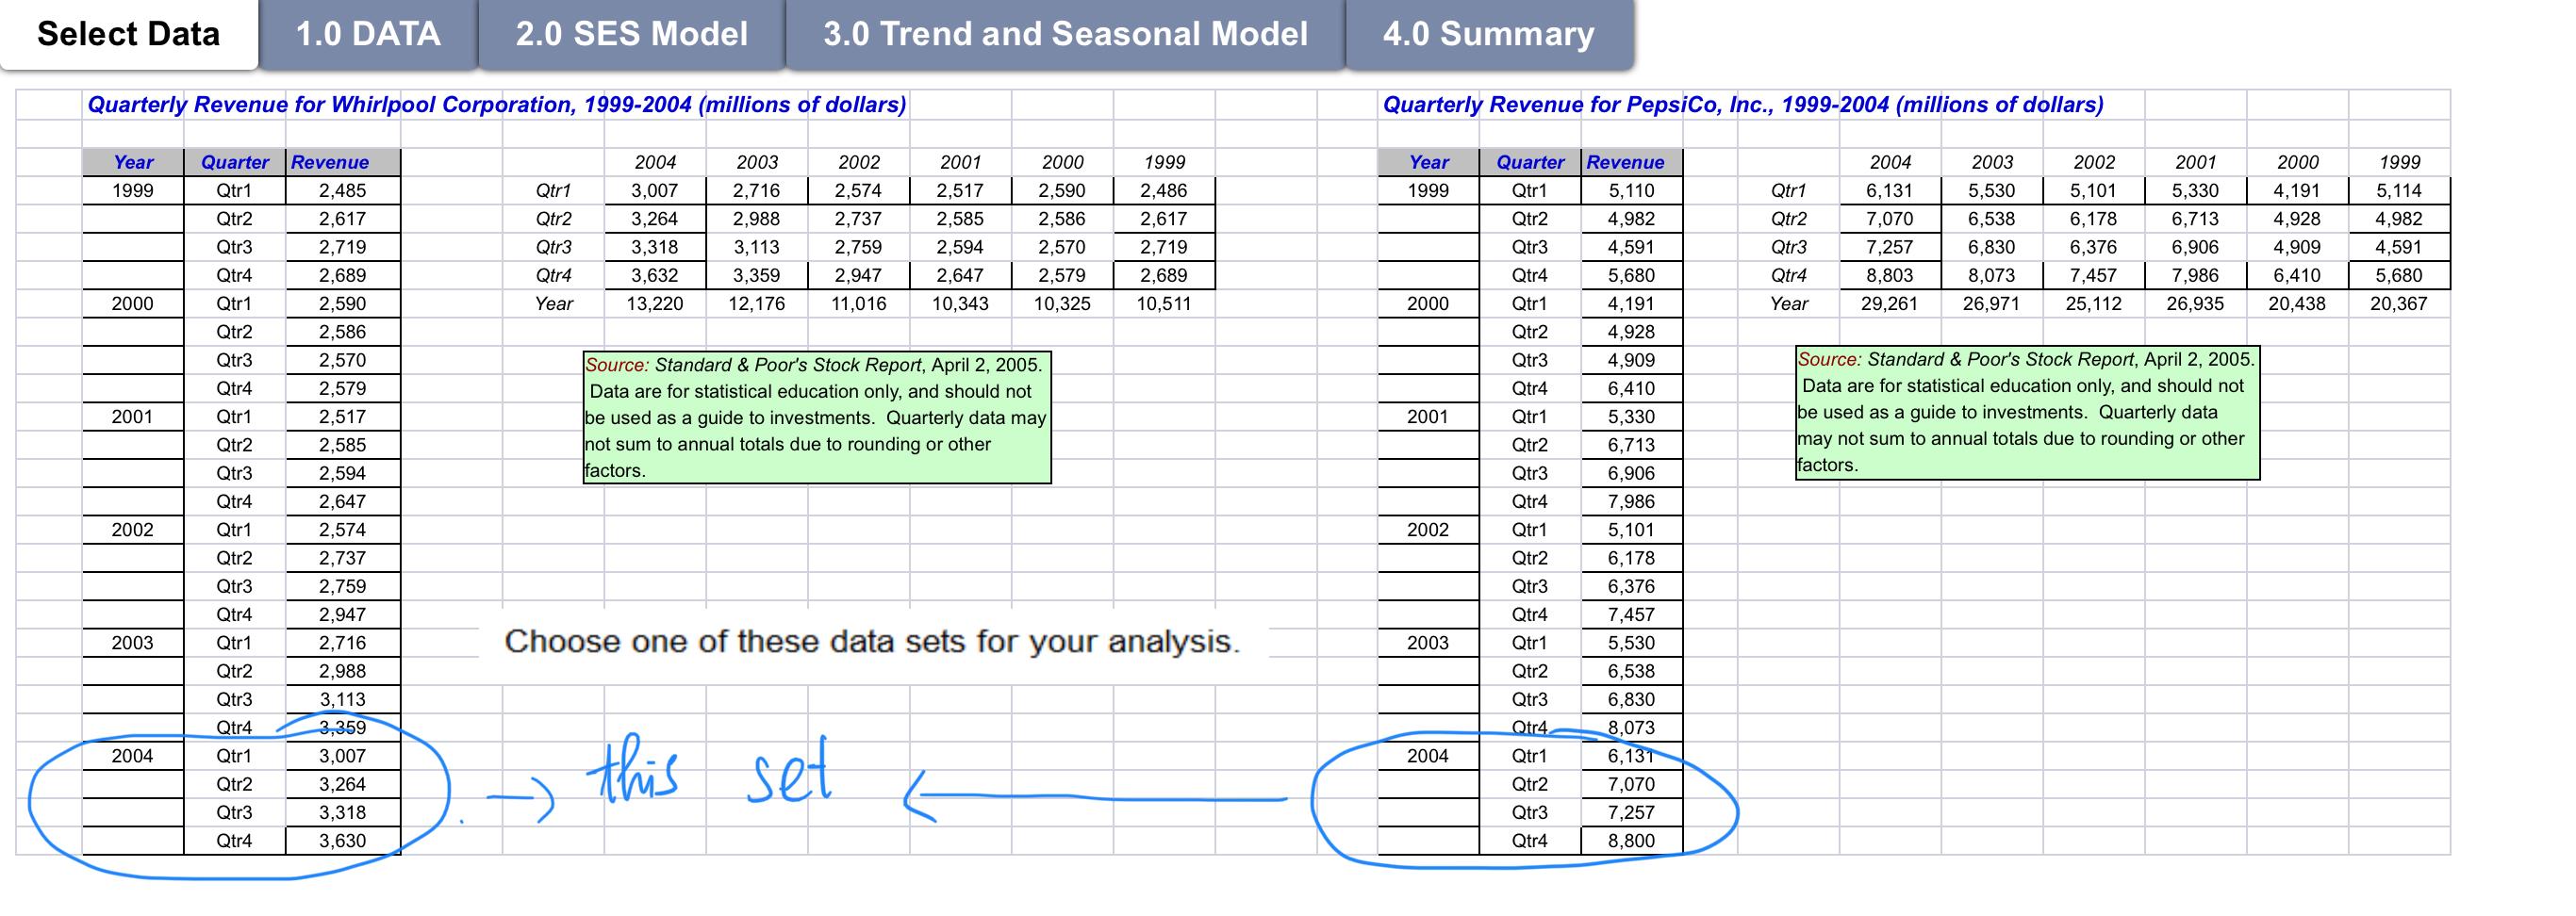
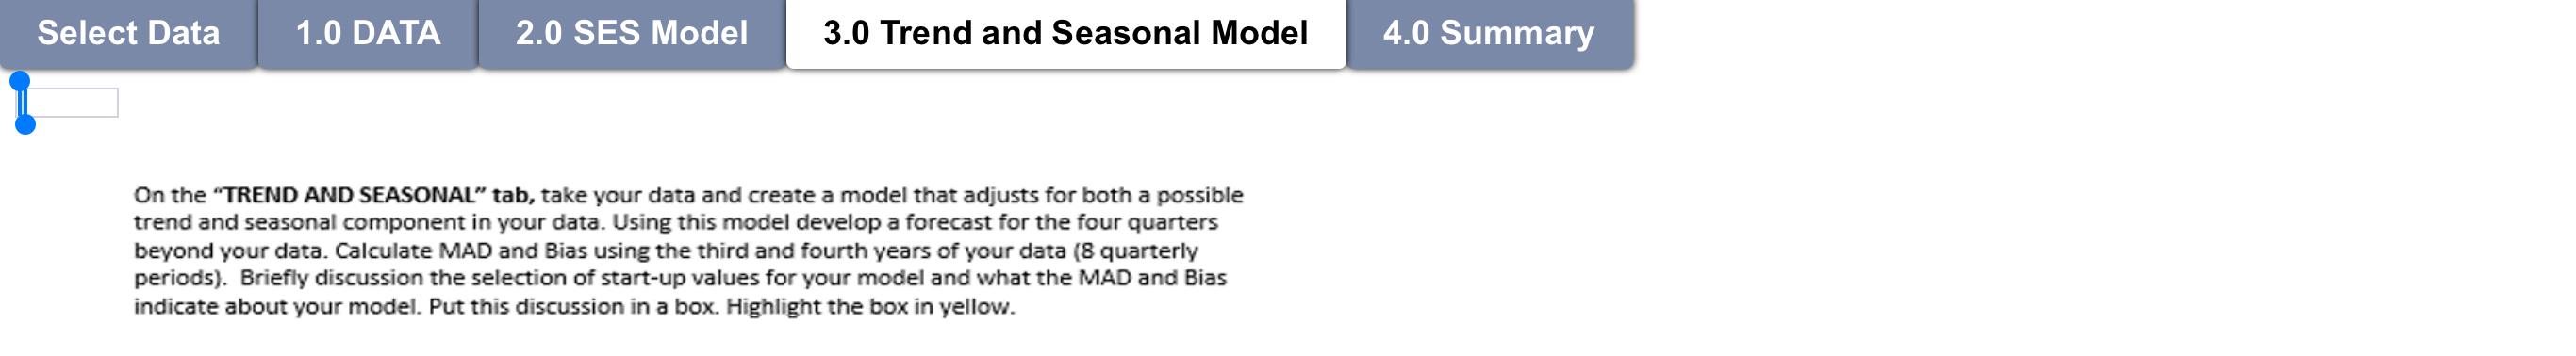
Select Data 1.0 DATA 2.0 SES Model 3.0 Trend and Seasonal Model 4.0 Summary Quarterly Revenue for Whirlpool Corporation, 1999-2004 (millions of dollars) Quarterly Revenue for PepsiCo, Inc., 1999-2004 (millions of dollars) Year Quarter Year 2000 1999 Qtr 1 1999 Qtr1 Qtr2 Qtr3 Qtr4 Qtr1 Qtr2 Qtr3 2004 3,007 3,264 3,318 3,632 13,220 2003 2,716 2,988 3,113 3,359 12,176 2002 2,574 2,737 2,759 2,947 11,016 2001 2,517 2,585 2,594 2,647 10,343 2000 2,590 2,586 2,570 2,579 10,325 1999 2,486 2,617 2,719 2,689 10,511 Qtr2 Qtr3 Qtr4 Year 2004 6,131 7,070 7,257 8,803 29,261 2003 5,530 6,538 6,830 8,073 26,971 2002 5,101 6,178 6,376 7,457 25,112 2001 5,330 6,713 6,906 7,986 26,935 4,191 4,928 4,909 6.410 20,438 1999 5,114 4,982 4,591 5,680 20,367 Qtr4 Year 2000 2000 Qtr 1 Qtr2 Qtr3 2001 Source: Standard & Poor's Stock Report, April 2, 2005. Data are for statistical education only, and should not be used as a guide to investments. Quarterly data may not sum to annual totals due to rounding or other factors. 2001 Source: Standard & Poor's Stock Report, April 2, 2005. Data are for statistical education only, and should not be used as a guide to investments. Quarterly data may not sum to annual totals due to rounding or other factors. Revenue 2,485 2,617 2,719 2,689 2,590 2,586 2,570 2,579 2,517 2,585 2,594 2,647 2,574 2,737 2,759 2,947 2,716 2,988 3,113 3,359 3,007 3,264 3,318 3,630 Quarter Revenue Qtr 1 5,110 Qtr2 4,982 Qtr3 4,591 Qtr4 5,680 Qtr 1 4,191 Qtr2 4,928 Qtr3 4,909 Qtr4 6,410 Qtr 1 5,330 Qtr2 6,713 Qtr3 6,906 Qtr4 7,986 Qtr 1 5,101 Qtr2 6,178 Qtr3 6,376 Qtr4 7,457 Qtr 1 5,530 Qtr2 6,538 Qtr3 6,830 8,073 Qtr 1 6,131 Qtr2 7,070 Qtr3 7,257 Qtr4 8,800 Qtr4 Qtr 1 Qtr2 Qtr3 Qtr4 Qtr 1 Qtr2 Qtr3 Qtr4 Qtr 1 Qtr2 Qtr3 Qtr4 Qtr 1 Qtr2 Qtr3 2002 2002 2003 Choose one of these data sets for your analysis. 2003 Otr4 2004 this set 2004 G Qtr4 Select Data 1.0 DATA 2.0 SES Model 3.0 Trend and Seasonal Model 4.0 Summary On the "TREND AND SEASONAL" tab, take your data and create a model that adjusts for both a possible trend and seasonal component in your data. Using this model develop a forecast for the four quarters beyond your data. Calculate MAD and Bias using the third and fourth years of your data (8 quarterly periods). Briefly discussion the selection of start-up values for your model and what the MAD and Bias indicate about your model. Put this discussion in a box. Highlight the box in yellow


