

Question: A B C D E F G H J K M N O P Firm Size Capital Intensity Ad Intensity Bad Debt Inventory Management Energy
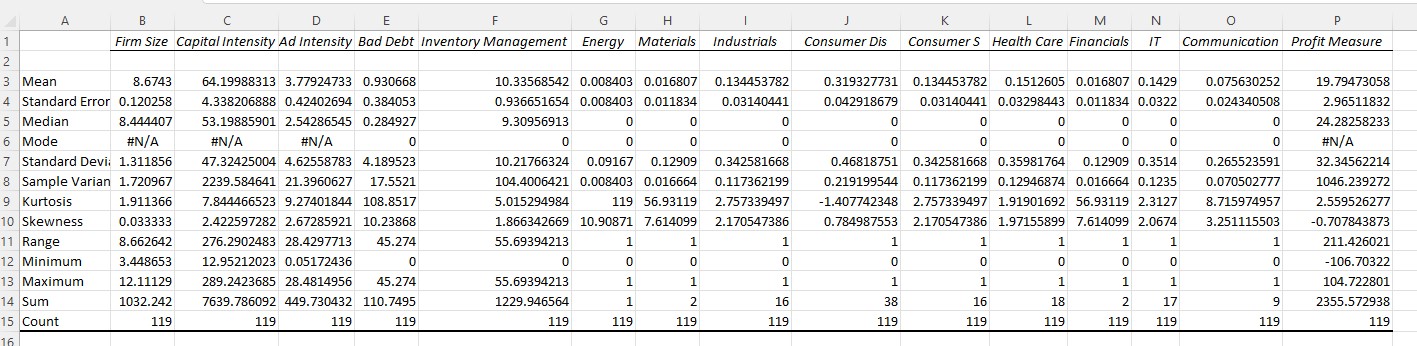
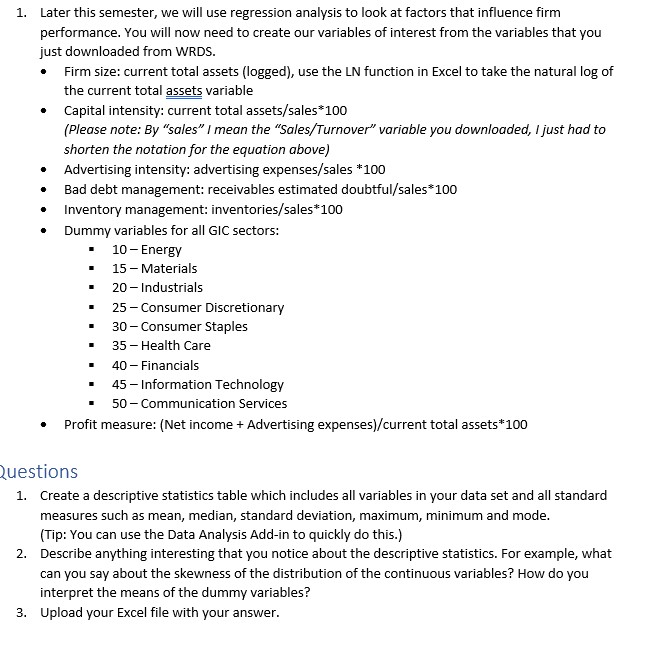


A B C D E F G H J K M N O P Firm Size Capital Intensity Ad Intensity Bad Debt Inventory Management Energy Materials Industrials Consumer Dis Consumer S Health Care Financials IT Communication Profit Measure Mean 8.6743 64.19988313 3.77924733 0.930668 10.33568542 0.008403 0.016807 0.134453782 0.319327731 0.134453782 0.1512605 0.016807 0.1429 0.075630252 19.79473058 Standard Error 0.120258 4.338206888 0.42402694 0.384053 0.936651654 0.008403 0.011834 0.03140441 0.042918679 0.03140441 0.03298443 0.011834 0.0322 0.024340508 2.96511832 Median 8.444407 53.19885901 2.54286545 0.284927 9.30956913 0 0 24.28258233 Mode #N/A #N/A #N/A #N/A Standard Devi: 1.311856 47.32425004 4.62558783 4.189523 10.21766324 0.09167 0.12909 0.342581668 0.46818751 0.342581668 0.35981764 0.12909 0.3514 0.265523591 32.34562214 Sample Varian 1.720967 2239.584641 21.3960627 17.5521 104.4006421 0.008403 0.016664 0.117362199 0.219199544 0.117362199 0.12946874 0.016664 0.1235 0.070502777 1046.239272 Kurtosis 1.911366 7.844466523 9.27401844 108.8517 5.015294984 119 56.93119 2.757339497 -1.407742348 2.757339497 1.91901692 56.93119 2.3127 8.715974957 2.559526277 10 Skewness 0.033333 2.422597282 2.67285921 10.23868 1.866342669 10.90871 7.614099 2.170547386 0.784987553 2.170547386 1.97155899 7.614099 2.0674 3.251115503 -0.707843873 11 Range 8.662642 276.2902483 28.4297713 45.274 55.69394213 1 1 1 1 1 1 1 1 1 211.426021 12 Minimum 3.448653 12.95212023 0.05172436 lo 0 0 0 0 0 0 -106.70322 13 Maximum 12.11129 289.2423685 28.4814956 45.274 55.69394213 1 1 1 1 1 1 1 104.722801 14 Sum 1032.242 7639.786092 449.730432 110.7495 1229.946564 2 16 38 16 18 IN 17 2355.572938 15 Count 119 119 119 119 119 119 119 119 119 119 119 119 119 119 1191. Later this semester, we will use regression analysis to look at factors that influence firm performance. You will now need to create our variables of interest from the variables that you just downloaded from WRDS. . Firm size: current total assets (logged), use the LN function in Excel to take the natural log of the current total assets variable . Capital intensity: current total assets/sales*100 (Please note: By "sales" I mean the "Sales/Turnover" variable you downloaded, I just had to shorten the notation for the equation above) Advertising intensity: advertising expenses/sales *100 . Bad debt management: receivables estimated doubtful/sales*100 Inventory management: inventories/sales*100 Dummy variables for all GIC sectors: 10 - Energy 15 - Materials 20- Industrials 25 - Consumer Discretionary 30- Consumer Staples 35 - Health Care 40 - Financials 45 - Information Technology 50- Communication Services Profit measure: (Net income + Advertising expenses)/current total assets*100 Questions 1. Create a descriptive statistics table which includes all variables in your data set and all standard measures such as mean, median, standard deviation, maximum, minimum and mode. (Tip: You can use the Data Analysis Add-in to quickly do this.) 2. Describe anything interesting that you notice about the descriptive statistics. For example, what can you say about the skewness of the distribution of the continuous variables? How do you interpret the means of the dummy variables? 3. Upload your Excel file with your
Step by Step Solution
There are 3 Steps involved in it

Get step-by-step solutions from verified subject matter experts