

Question: Introduction This project will be completed in groups of 4. You will CHOOSE your group. If you don't know anyone in the class, I can
Introduction
This project will be completed in groups of 4. You will CHOOSE your group. If you don't know anyone in the class, I can assign you a group.
Each group will produce a 10 minute (maximum) presentation. The Powerpoint presentation, Video Recording and Ratio calculations in Excel must be uploaded to Moodle by one group member to the dropbox under the "Ratio Project" section.
Please read through the rest of this document to learn the specific requirements of this report along with the case to be analyzed.
The Case
Home Hardware Ltd. is an industrial supply company. Home Hardware primarily supplies finishing products to condominium, apartment and industrial building construction companies. A new customer, Builder Mart Ltd., would like to make a $550,000 purchase of paint and related supplies. This is a large order for Home Hardware which would be close to 15% of all average current sales for Home Hardware for a year. You have been asked to provide a recommendation on whether or not to extend credit (hint: short term loan) to Builder Mart.
Builder Mart's CFO has also proposed two other potential investment options if Home Hardware is interested. One option would be to grant long-term credit to Builder Mart. Another option is Home Hardware purchase shares in Builder Mart. You are to consider and conclude on all three issues. You are reporting to the CEO of Home Hardware Ltd.
See Builder Mart's financial information in the Excel Template.
Video Presentation Format
The analysis and presentation will be based on the financial information extracted from Builder Mart Ltd. financial information enclosed. The requirements are as follows:
Your group is a financial consulting firm (make up your own company name), and your firm has been hired by the CEO of Home Hardware Ltd. to provide a presentation. The CEO is the audience of your Presentation. Home Hardware Ltd. is considering three possible ways to be involved with Builder Mart Ltd.:
- grant them short-term credit
- grant them long-term credit
- purchase shares of Builder Mart
Your task of this project is to analyze the financial data and conclude on all three options. You need to recommend the BEST option and give your reasons.You have been provided industry information to be used as an industry benchmark.
You are expected to produce a formal presentation to the CEO of Home Hardware. This will include a Powerpoint presentation AND a filmed video walk-through of that presentation AND a copy of your ratios in Excel. You will not present this to the class. The flow of the project should be as follows:
- Introduction (maximum 1 minute) (5 marks) -Please introduce each team member and clearly state what the presentation will address. An introductory slide and agenda would be recommended in your slide deck.
- Analysis(maximum 6 minutes) (40 marks) - Five sections need to be addressed: Profitability, Asset Utilization, Liquidity, Debt Utilization, and Other Items. You should present high level analysis for each one, based on the ratios you are presenting in your Appendix.
- You will likely want to discuss and highlight:
- the trend of the ratios from year to year and compared to Industry
- what the ratios tell us about the company in general or its financial management.
- any inter-relationships between ratios that might be important.
- HINT: you need to go beyond simply commenting on increase/decrease or better or worse than prior years or industry. Consider how the ratios relate to the financial statement accounts. For example, if the current ratio is increasing because inventory is increasing, is that an advantage or disadvantage? If the ratios indicate any problem areas or good financial management, provide your observations and comments. DO NOT define each ratio... this will not yield any marks.
- Other items- Under the "other items" heading, you should consider and comment on at least 3 items outside of the chapter 3 ratios required. This section will consist of a vertical analysis, also known as common size analysis, plus you should select several chapter two ratios to calculate and analyze.
- Conclusion and Recommendations (Maximum 3 minutes) (15 marks) - Based on your analysis, state and explain why Home Hardware should or should not:
- grant short-term credit
- grant long-term credit
- consider purchasing shares
TIP: If you had to pick just one option, which one would it be? Make sure that is clear to the audience.
- An Appendix, consisting of a Ratios Page and Vertical Analysis (10 marks)
- Please determine all ratios in Excel. A template has been provided for you for ease of calculation.
- You do not have to show the calculations for the ratios.
- Presentation Quality and Professionalism.(30 marks) ALL team members must present. You will not be expected on screen at the same time but please only submit one final presentation to the CEO of Home Hardware (so some video editing may be required).
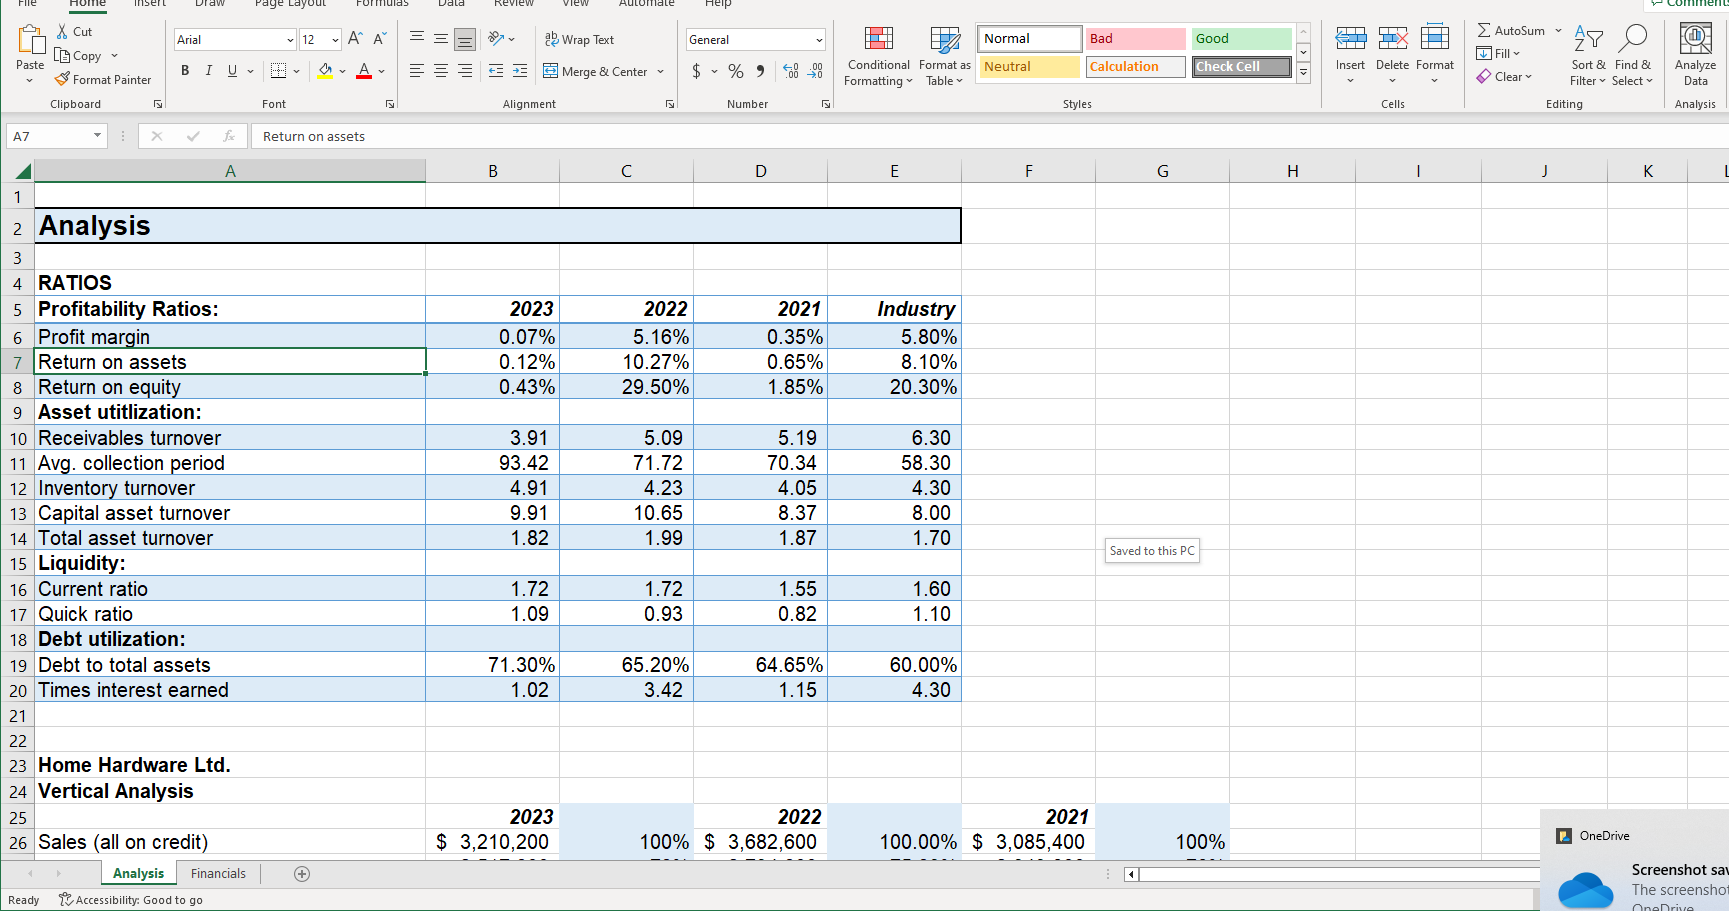
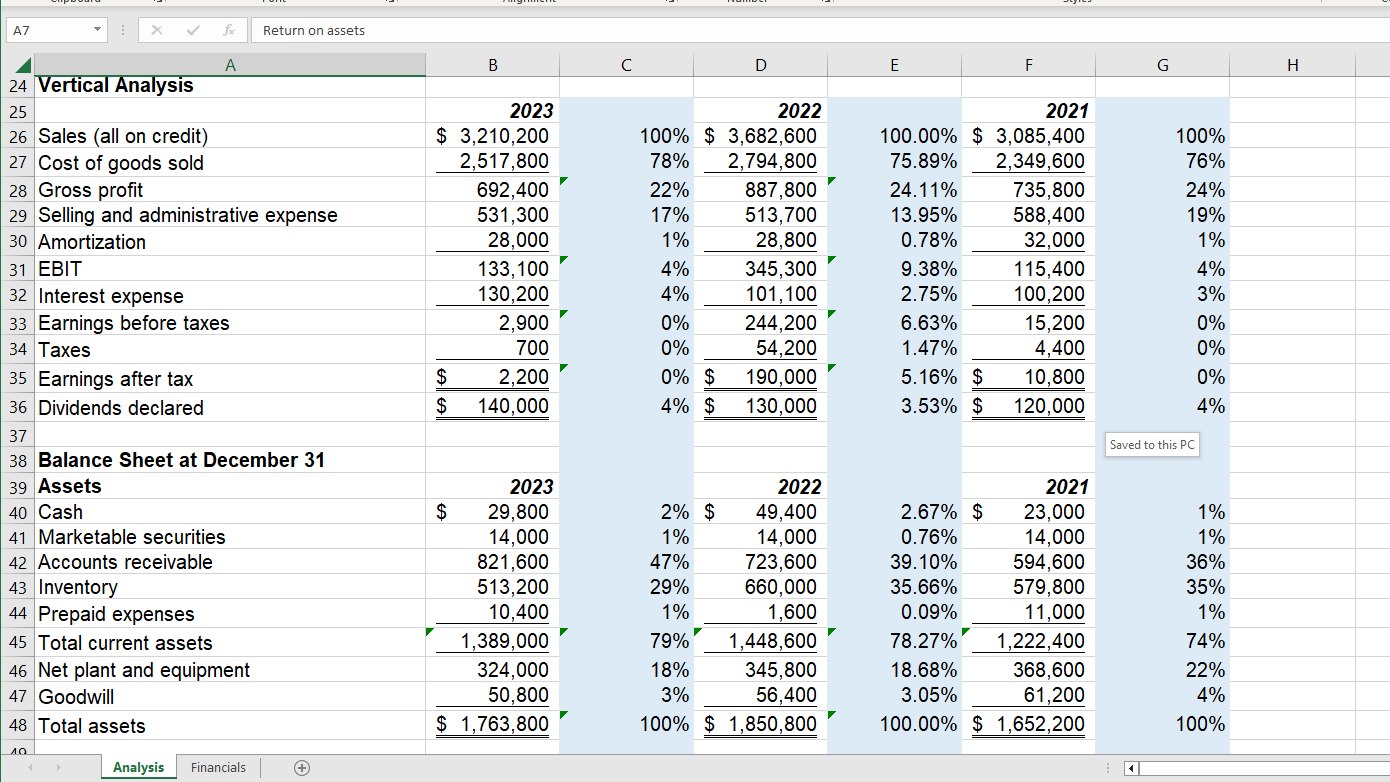
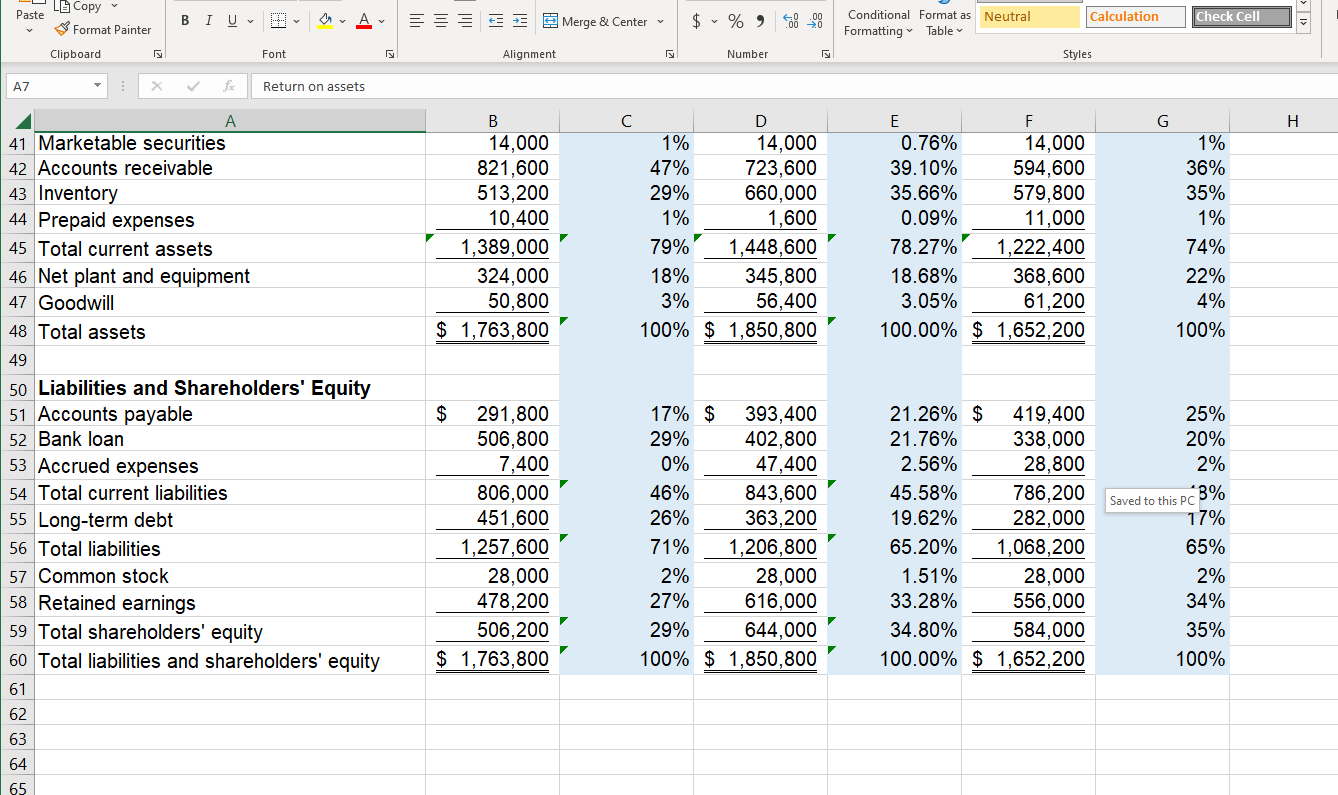
X Cut Arial 12 ~ A A de Wrap Text General Normal AutoSum Bad Good AY O Paste LL Copy Fill Format Painter BIU E Merge & Center 9 00 .00 Conditional Format as |Neutral Calculation Check Cell Insert Delete Format Sort & Find & Analyze Formatting ~ Table v Clear Filter ~ Select Data Clipboard Font Alignment Number Styles Cells Editing Analysis A7 X V Return on assets A B C D E F G H J K Analysis I w RATIOS 5 Profitability Ratios: 2023 2022 2021 Industry 6 Profit margin 0.07% 5.16% 0.35% 5.80% Return on assets 0. 12% 10.27% 0.65% 8.10% 8 Return on equity 0.43% 29.50% 1.85% 20.30% 9 Asset utitlization: 10 Receivables turnover 3.91 5.09 5.19 6.30 11 Avg. collection period 93.42 71.72 70.34 58.30 12 Inventory turnover 4.91 4.23 4.05 4.30 13 Capital asset turnover 9.91 10.65 8.37 8.00 14 Total asset turnover 1.82 1.99 1.87 1.70 Saved to this PC 15 Liquidity: 16 Current ratio 1.72 1.72 1.55 1.60 17 Quick ratio 1.09 0.93 0.82 1.10 18 Debt utilization: 19 Debt to total assets 71.30% 65.20% 64.65% 60.00% 20 Times interest earned 1.02 3.42 1.15 4.30 21 22 23 Home Hardware Ltd. 24 Vertical Analysis 25 2023 2022 2021 26 Sales (all on credit) $ 3,210,200 100% $ 3,682,600 100.00% $ 3,085,400 100% OneDrive Analysis Financials + Screenshot sa The screensho Read Accessibility: Good to goA7 X V & Return on assets A B C D E F G H 24 Vertical Analysis 25 2023 2022 2021 26 Sales (all on credit) $ 3,210,200 100% $ 3,682,600 100.00% $ 3,085,400 100% 27 Cost of goods sold 2,517,800 78% 2,794,800 75.89% 2,349,600 76% 28 Gross profit 692,400 22% 887,800 24.11% 735,800 24% 29 Selling and administrative expense 531,300 17% 513,700 13.95% 588,400 19% 30 Amortization 28,000 1% 28,800 0.78% 32,000 1% 31 EBIT 133, 100 4% 345,300 9.38% 115,400 4% 32 Interest expense 130,200 4% 101, 100 2.75% 100,200 3% 33 Earnings before taxes 2,900 0% 244,200 6.63% 15,200 0% 34 Taxes 700 0% 54,200 1.47% 4,400 0% 35 Earnings after tax 2,200 0% $ 190,000 5.16% $ 10,800 0% 36 Dividends declared $ 140,000 4% $ 130,000 3.53% $ 120,000 4% 37 Saved to this PC 38 Balance Sheet at December 31 39 Assets 2023 2022 2021 40 Cash $ 29,800 2% $ 49,400 2.67% $ 23,000 1% 41 Marketable securities 14,000 1% 14,000 0.76% 14,000 1% 42 Accounts receivable 821,600 47% 723,600 39.10% 594,600 36% 43 Inventory 513,200 29% 660,000 35.66% 579,800 35% 44 Prepaid expenses 10,400 1% 1,600 0.09% 11,000 1% 45 Total current assets 1,389,000 79% 1,448,600 78.27% 1,222,400 74% 46 Net plant and equipment 324,000 18% 345,800 18.68% 368,600 22% 47 Goodwill 50,800 3% 56,400 3.05% 61,200 4% 48 Total assets $ 1,763,800 100% $ 1,850,800 100.00% $ 1,652,200 100% Analysis Financials +Paste LG Copy Format Painter BIU ~ SEE Merge & Center $ ~ % " Conditional Format as Neutral Calculation Check Cell Formatting ~ Table Clipboard Font Alignment Number Styles A7 X V Return on assets A B C D E F G H 41 Marketable securities 14,000 1% 14,000 0.76% 14,000 1% 42 Accounts receivable 821,600 47% 723,600 39. 10% 594,600 36% 43 Inventory 513,200 29% 660,000 35.66% 579,800 35% 44 Prepaid expenses 10,400 1% 1,600 0.09% 11,000 1% 45 Total current assets 1,389,000 79% 1,448,600 78.27% 1,222,400 74% 46 Net plant and equipment 324,000 18% 345,800 18.68% 368,600 22% 47 Goodwill 50,800 3% 56,400 3.05% 61,200 4% 48 Total assets $ 1,763,800 100% $ 1,850,800 100.00% $ 1,652,200 100% 49 50 Liabilities and Shareholders' Equity 51 Accounts payable $ 291,800 17% $ 393,400 21.26% $ 419,400 25% 52 Bank loan 506,800 29% 402,800 21.76% 338,000 20% 53 Accrued expenses 7,400 0% 47,400 2.56% 28,800 2% 54 Total current liabilities 806,000 46% 843,600 45.58% 786,200 Saved to this PC 3% 55 Long-term debt 451,600 26% 363,200 19.62% 282,000 17% 56 Total liabilities 1,257,600 71% 1,206,800 65.20% 1,068,200 65% 57 Common stock 28,000 2% 28,000 1.51% 28,000 2% 58 Retained earnings 478,200 27% 616,000 33.28% 556,000 34% 59 Total shareholders' equity 506,200 29% 644,000 34.80% 584,000 35% 60 Total liabilities and shareholders' equity $ 1,763,800 100% $ 1,850,800 100.00% $ 1,652,200 100% 61 62 63 64 65
Step by Step Solution
There are 3 Steps involved in it

Get step-by-step solutions from verified subject matter experts