

Question: A B C D E F G H K L M N O P Q R S T U V W Data X Data Table
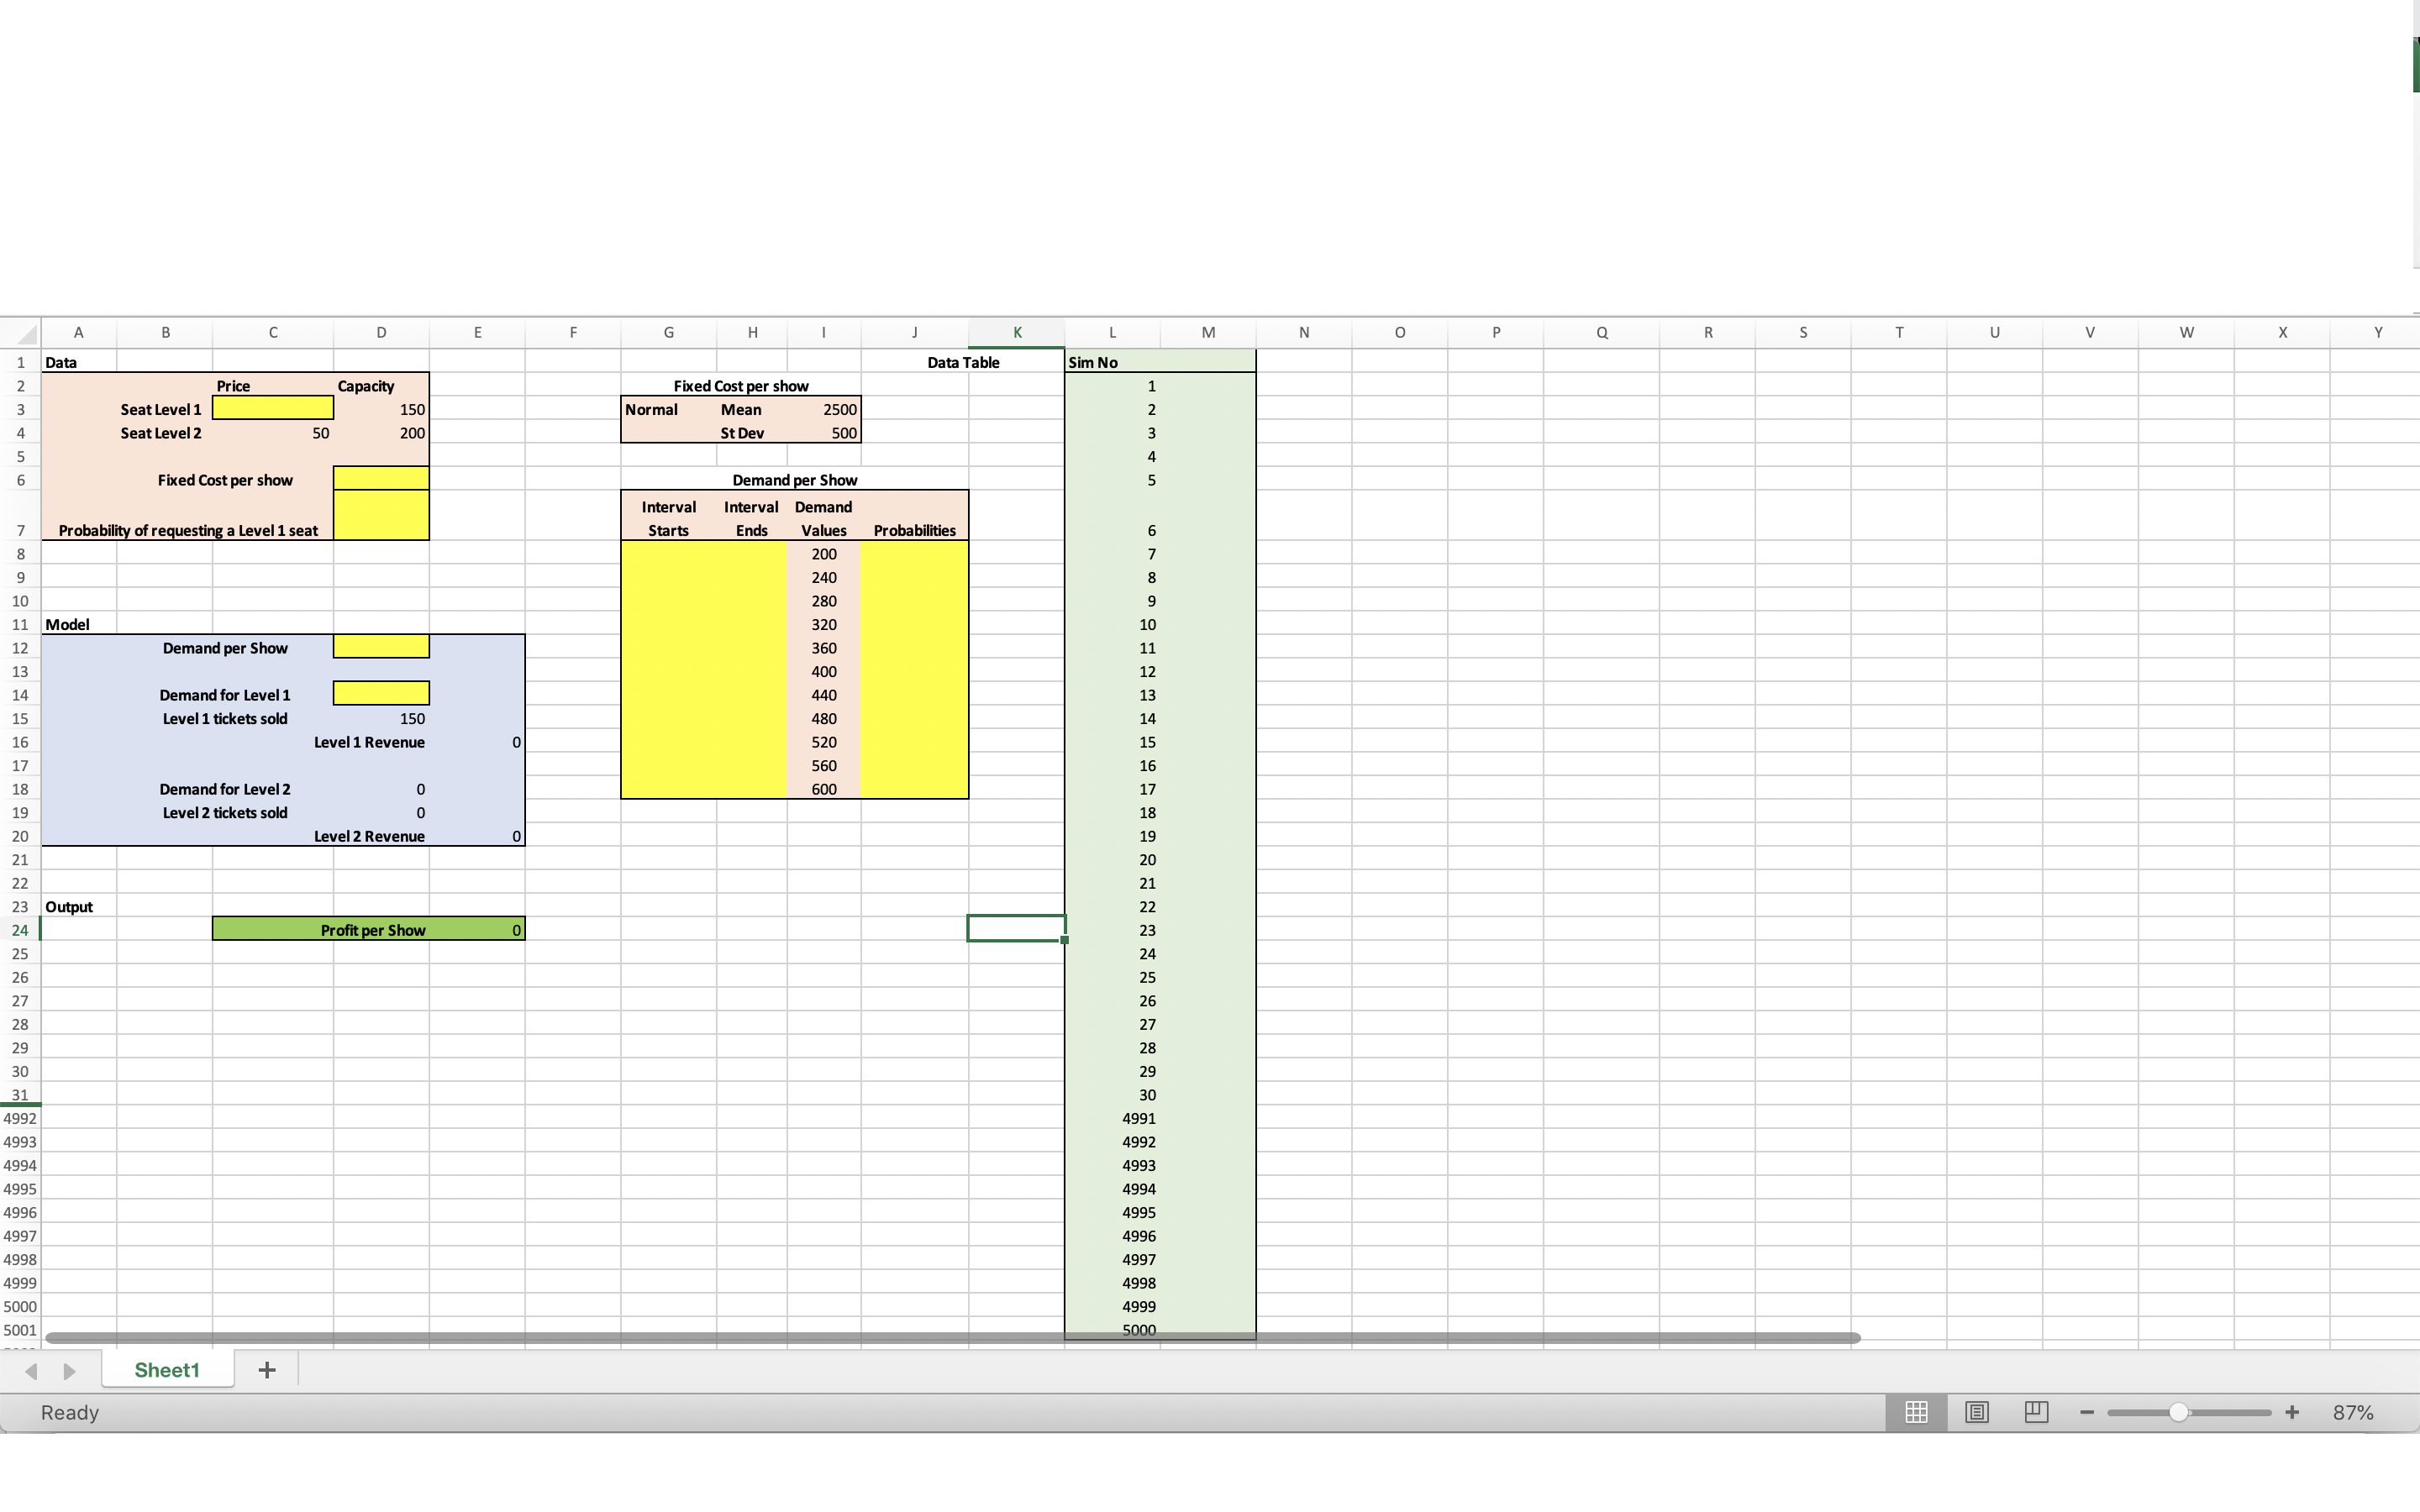
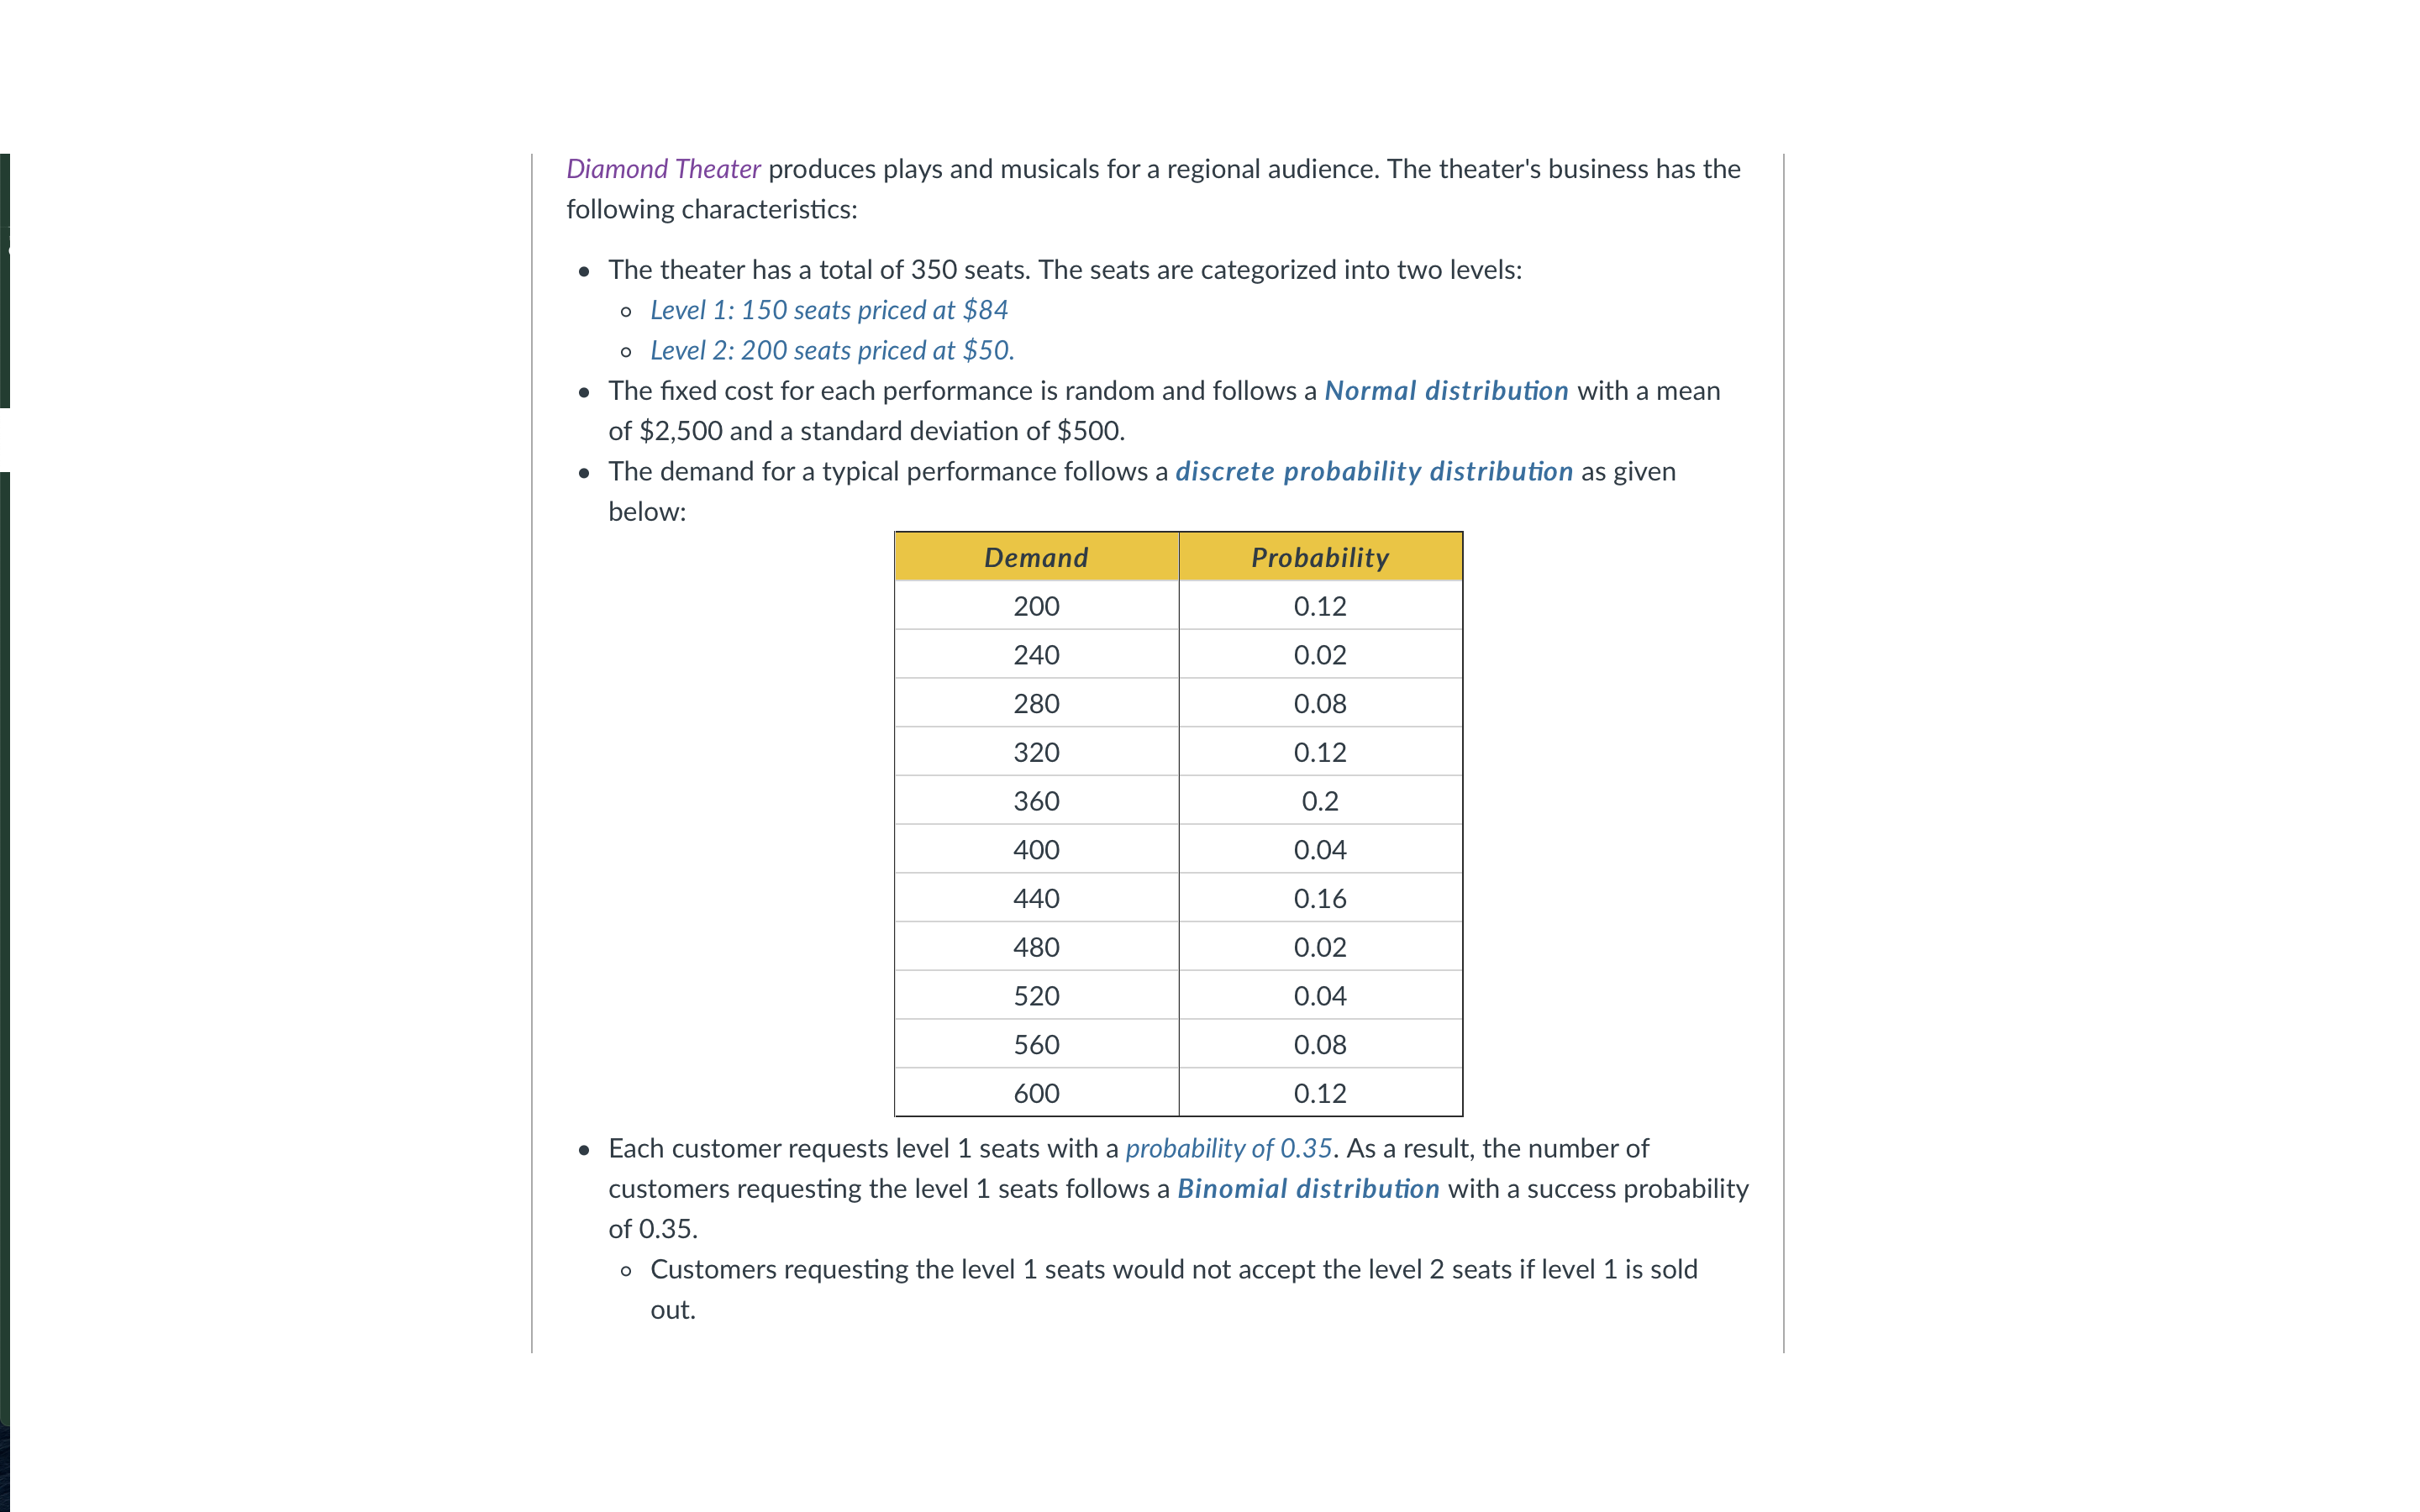
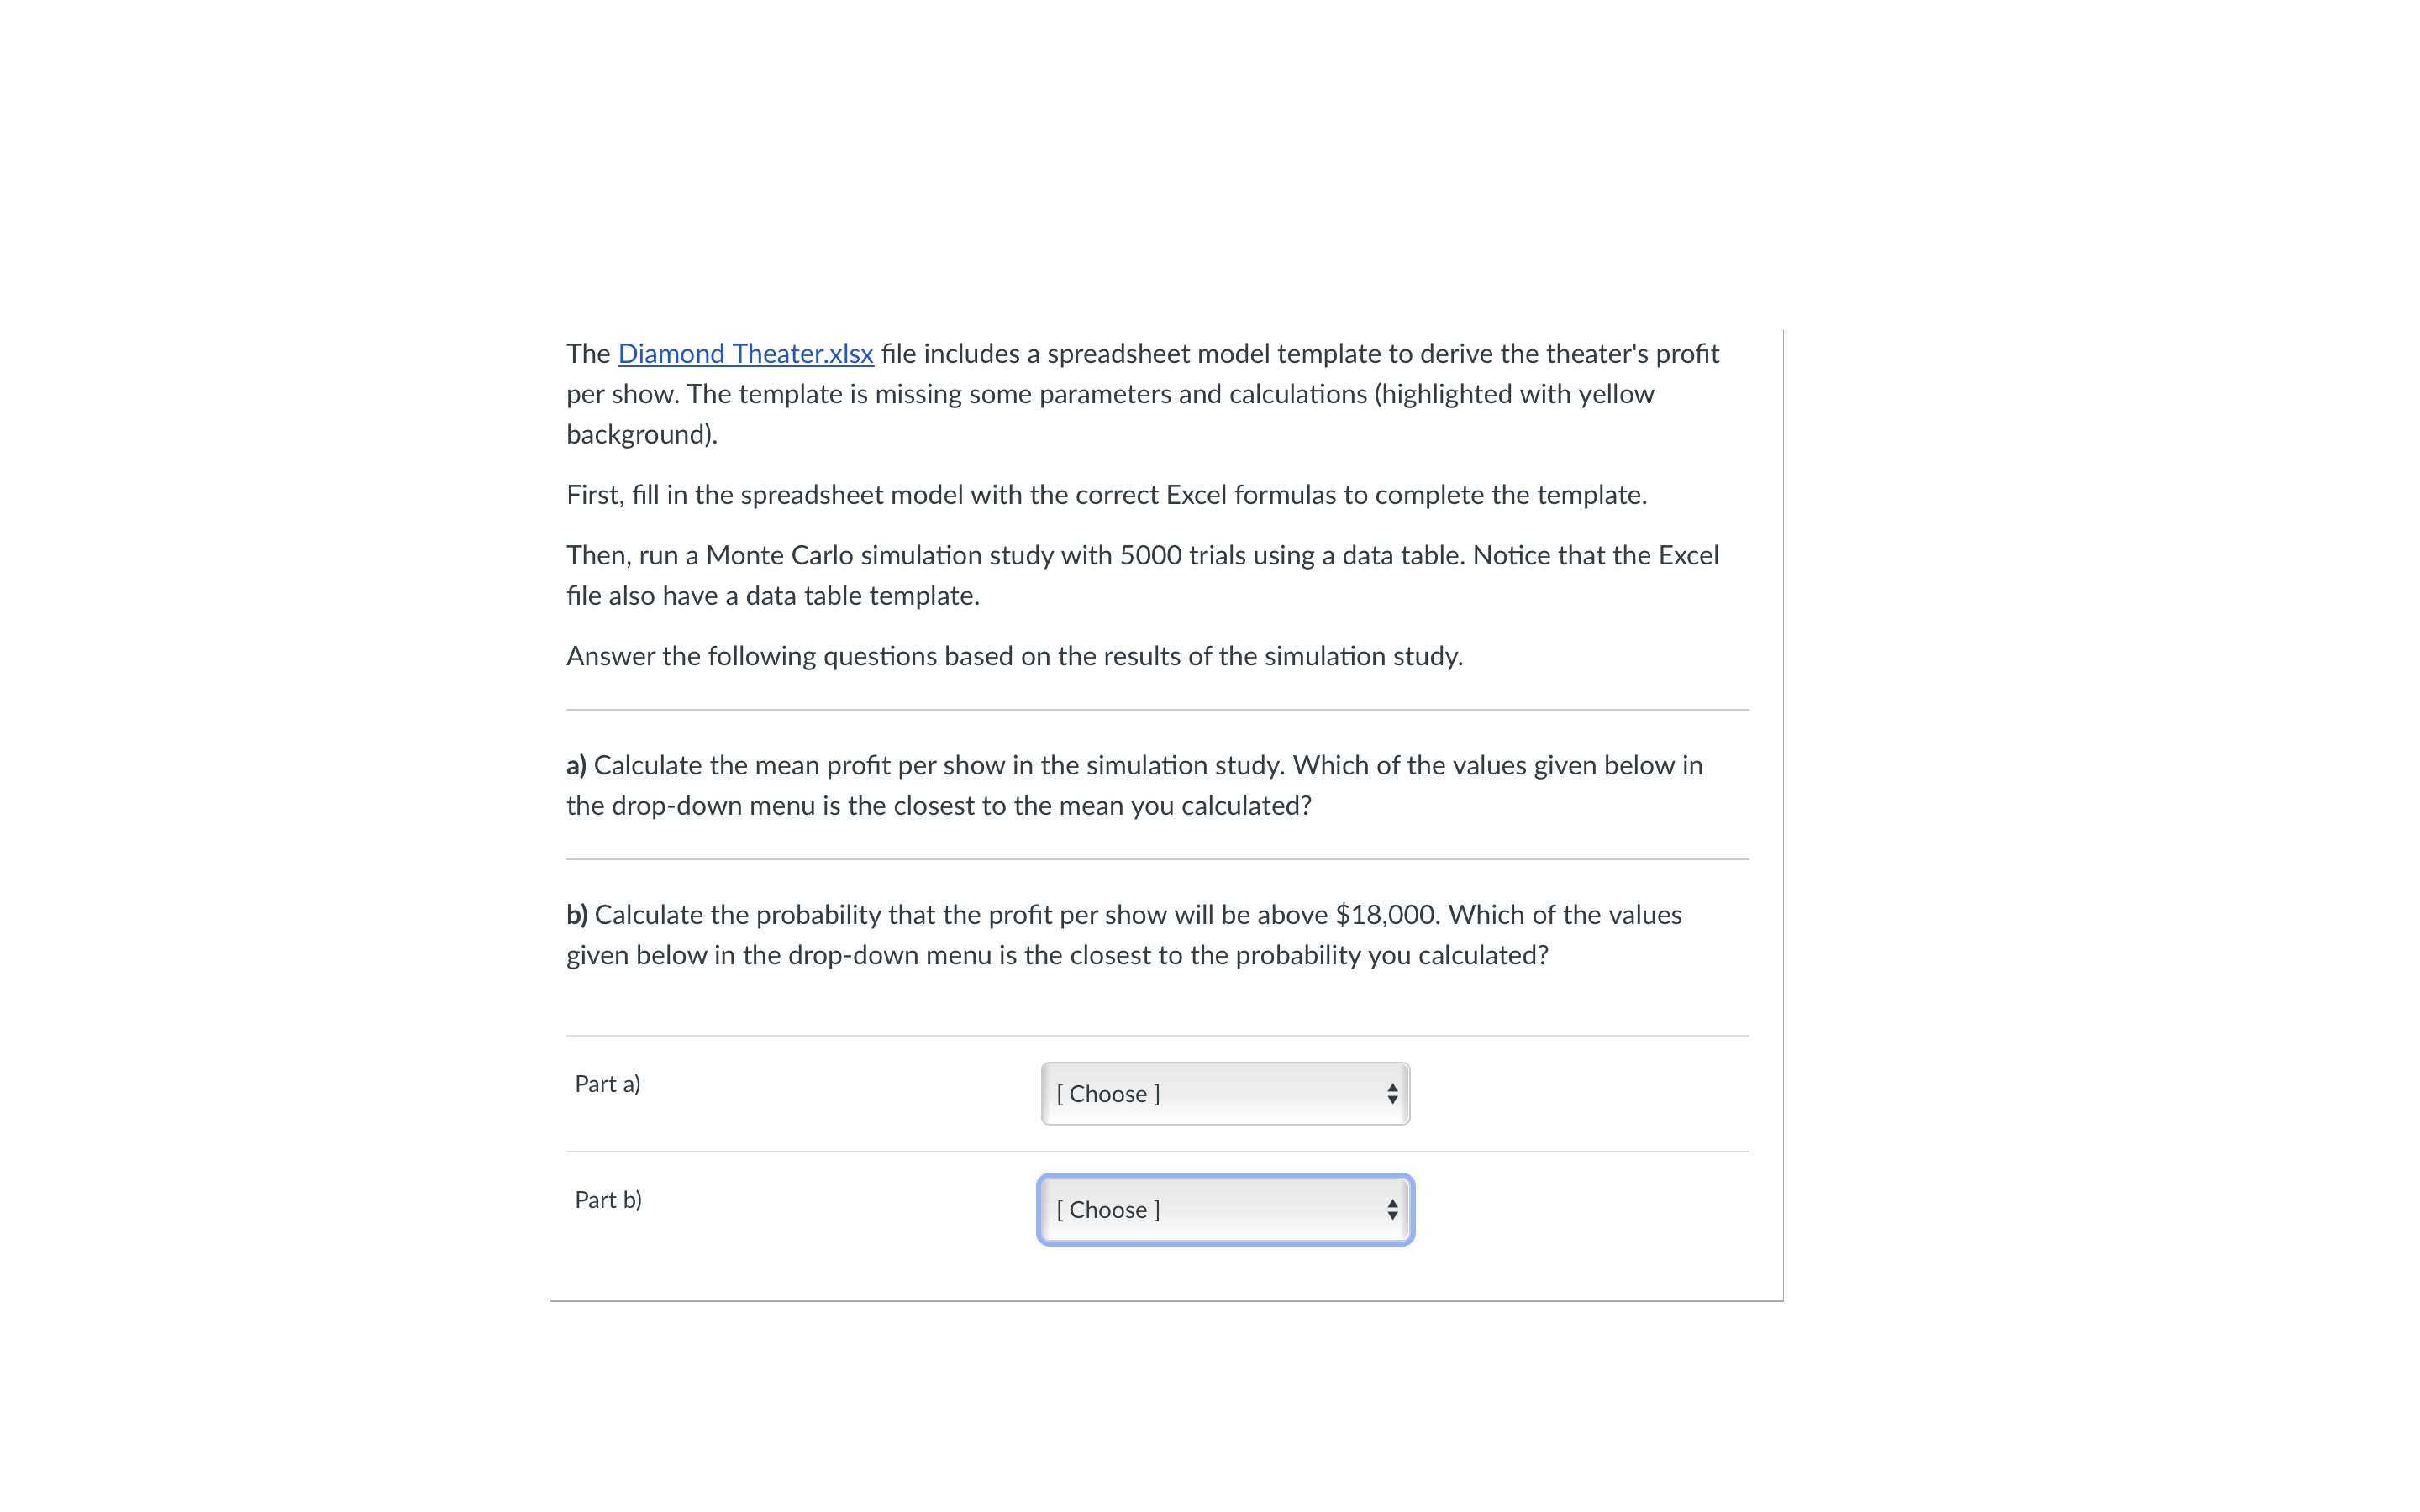
A B C D E F G H K L M N O P Q R S T U V W Data X Data Table Sim No Price Capacity Fixed Cost per show Seat Level 1 150 Normal near 2500 Seat Level 2 50 200 St Dev 500 UPWNH Fixed Cost per show Demand per Show Interval Interval Demand Probability of requesting a Level 1 seat Starts Ends Values Probabilities 200 240 280 11 Model 320 12 Demand per Show 360 13 400 14 Demand for Level 1 440 15 Level 1 tickets sold 150 480 16 Level 1 Revenue 17 520 560 18 Demand for Level 2 600 19 Level 2 tickets sold 20 Level 2 Revenue 0 21 22 23 Output 24 Profit per Show 25 26 27 28 31 4992 1991 4993 4992 4994 4993 4995 4994 4996 4995 4997 4996 4998 4997 4999 5000 1998 5001 4999 5000 Sheet1 + Ready + 87%Diamond Theater produces plays and musicals for a regional audience. The theater's business has the following characteristics: . The theater has a total of 350 seats. The seats are categorized into two levels: 0 Level 1: 150 seats priced at $84 0 Level 2: 200 seats priced at $50. o The xed cost for each performance is random and follows a Normal distribution with a mean of $2,500 and a standard deviation of $500. . The demand for a typical performance follows a discrete probability distribution as given below: 200 0.12 240 0.02 280 0.08 320 0.12 360 0.2 400 0.04 440 0.16 480 0.02 520 0.04 560 0.08 600 0.12 0 Each customer requests level 1 seats with a probability of 0.35. As a result, the number of customers requesting the level 1 seats follows a Binomial distribution with a success probability of 0.35. 0 Customers requesting the level 1 seats would not accept the level 2 seats if level 1 is sold out. The Diamond Theater.xlsx le includes a spreadsheet model template to derive the theater's prot per show. The template is missing some parameters and calculations (highlighted with yellow background). First, ll in the spreadsheet model with the correct Excel formulas to complete the template. Then, run a Monte Carlo simulation study with 5000 trials using a data table. Notice that the Excel le also have a data table template. Answer the following questions based on the results of the simulation study. a) Calculate the mean prot per show in the simulation study. Which of the values given below in the drop-down menu is the closest to the mean you calculated? b) Calculate the probability that the prot per show will be above $18,000. Which of the values given below in the drop-down menu is the closest to the probability you calculated? Part a) l [Choose] Part b)
Step by Step Solution
There are 3 Steps involved in it

Get step-by-step solutions from verified subject matter experts