

Question: A B C D E values highlighted below. Pick and place the data PROVIDED TO YOU IN THE PROBLEM in place of You are given
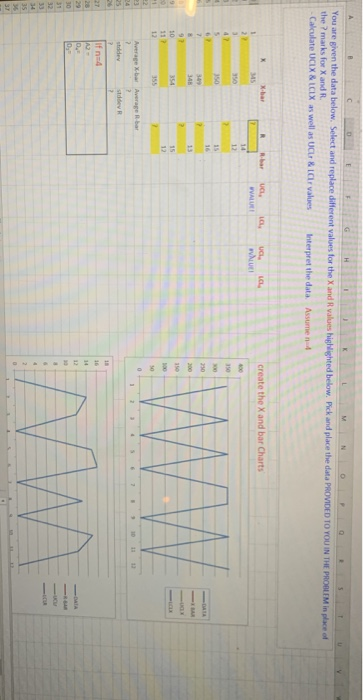
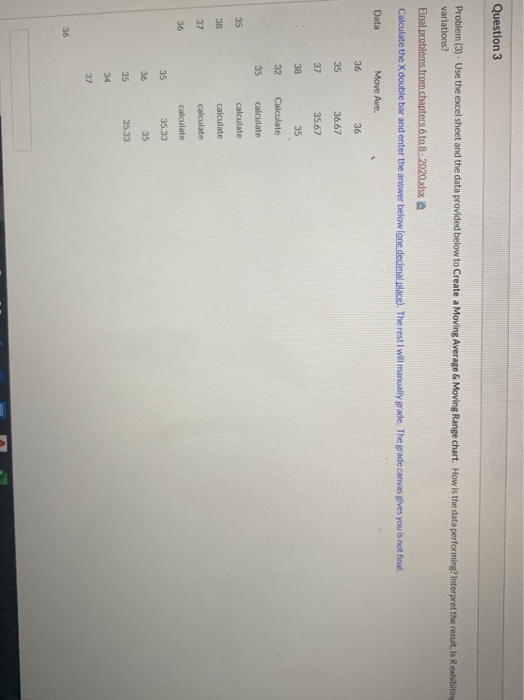
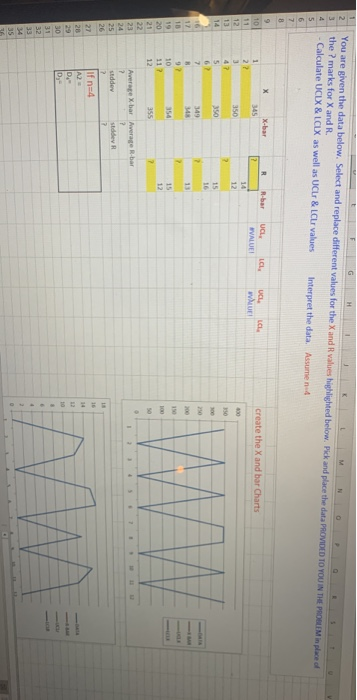
A B C D E values highlighted below. Pick and place the data PROVIDED TO YOU IN THE PROBLEM in place of You are given the data below. Select and replace different values for the X and the marks for X and R. Calculate UCIX & LCLX as well as UCL ir values Interpret the data Assumen X and bar Charts UL WVALUE NU Question 3 Problem (3) - Use the excel sheet and the data provided below to Create a Moving Average & Moving Range chart. How is the data performing? Interpret the result, is Rexhibiting variations? Final problems from chapters 6 to 8.2020.xlsx Calculate the X double bar and enter the answer below lone decimal place). The rest I will manually grade. The grade canvas gives you is not final Data Move Ave. 36 36.67 35.67 35 Calculate calculate calculate calculate calculate calculate 35.33 35.33 given the data below. Select and replace different values for the X and Rvs g hted below. Pick and place the data PROVIDED TO YOU IN THE PROGLIM the marks for X and R. Calculate UCLX & LOLX as well as UCL & LCL values interpret the data asument place WE Create the X and bar Charts BERNAR UT A B C D E values highlighted below. Pick and place the data PROVIDED TO YOU IN THE PROBLEM in place of You are given the data below. Select and replace different values for the X and the marks for X and R. Calculate UCIX & LCLX as well as UCL ir values Interpret the data Assumen X and bar Charts UL WVALUE NU Question 3 Problem (3) - Use the excel sheet and the data provided below to Create a Moving Average & Moving Range chart. How is the data performing? Interpret the result, is Rexhibiting variations? Final problems from chapters 6 to 8.2020.xlsx Calculate the X double bar and enter the answer below lone decimal place). The rest I will manually grade. The grade canvas gives you is not final Data Move Ave. 36 36.67 35.67 35 Calculate calculate calculate calculate calculate calculate 35.33 35.33 given the data below. Select and replace different values for the X and Rvs g hted below. Pick and place the data PROVIDED TO YOU IN THE PROGLIM the marks for X and R. Calculate UCLX & LOLX as well as UCL & LCL values interpret the data asument place WE Create the X and bar Charts BERNAR UT
Step by Step Solution
There are 3 Steps involved in it

Get step-by-step solutions from verified subject matter experts