

Question: (A) (B) (C) (D) The production function for hamburgers can be written as q = 0.1X + 0.1Y, where X is Canadian ground beef and

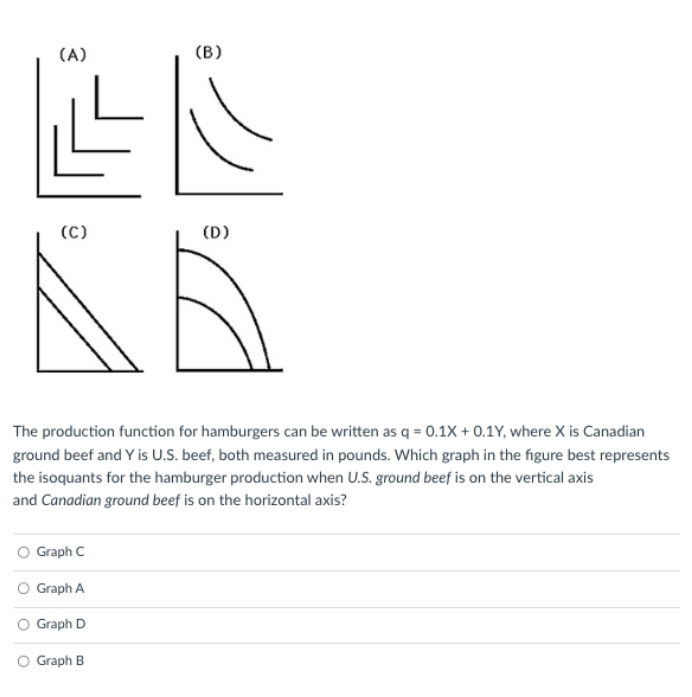
(A) (B) (C) (D) The production function for hamburgers can be written as q = 0.1X + 0.1Y, where X is Canadian ground beef and Y is U.S. beef, both measured in pounds. Which graph in the figure best represents the isoquants for the hamburger production when U.S. ground beef is on the vertical axis and Canadian ground beef is on the horizontal axis? O Graph C O Graph A O Graph D O Graph B
Step by Step Solution
There are 3 Steps involved in it
1 Expert Approved Answer
Step: 1 Unlock

Question Has Been Solved by an Expert!
Get step-by-step solutions from verified subject matter experts
Step: 2 Unlock
Step: 3 Unlock