

Question: A. B. c. Q D. Q () . This is an example of what type of graph? histogram flowchart (process diagram) statistical process control chart
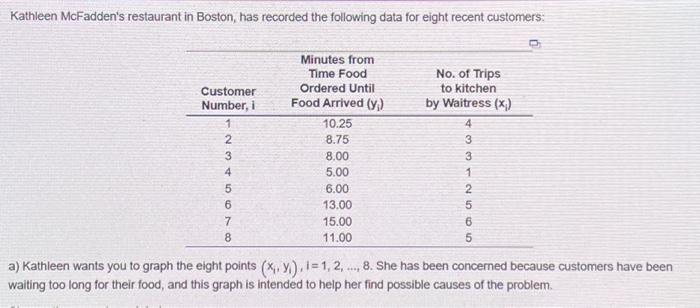
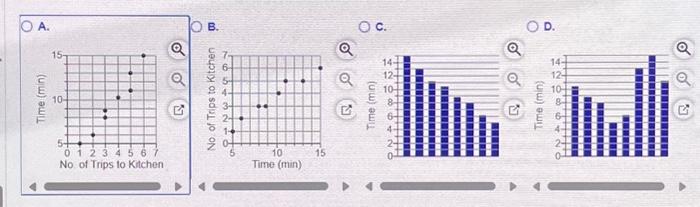
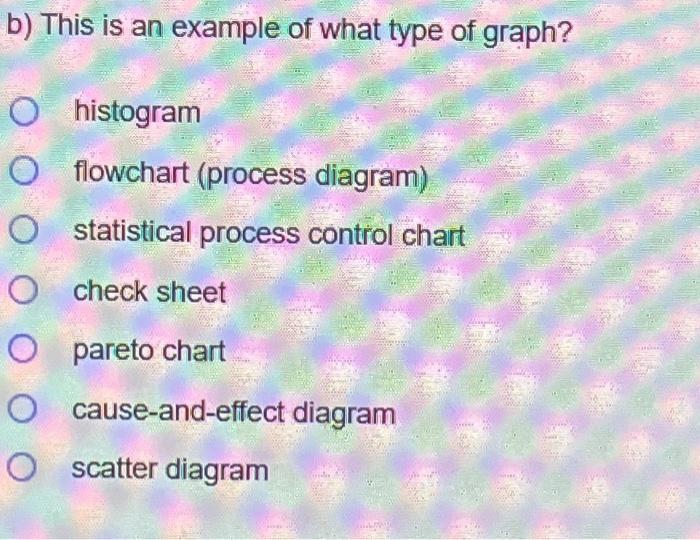
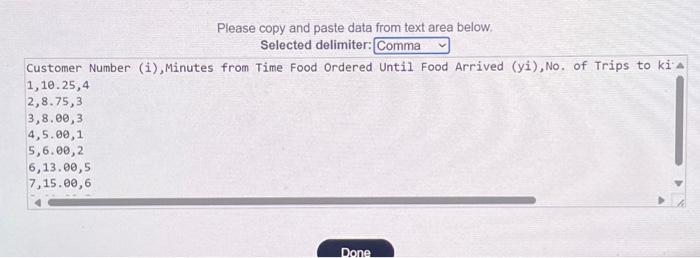
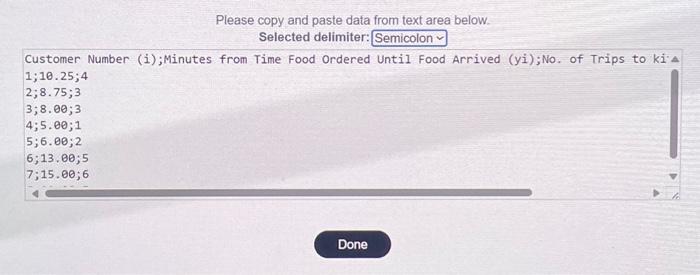
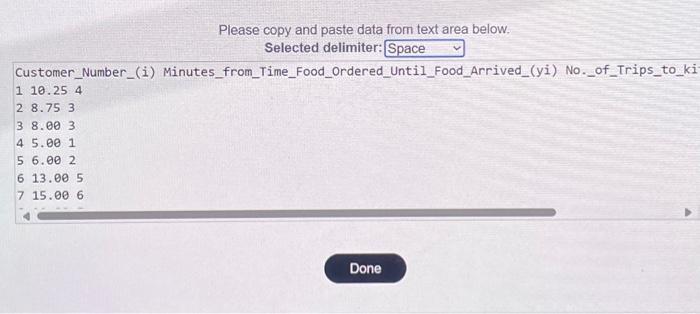
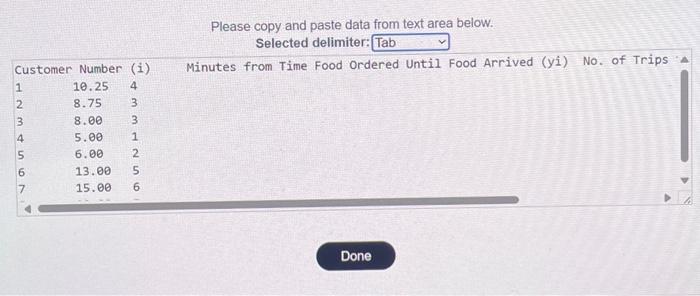
A. B. c. Q D. Q () . This is an example of what type of graph? histogram flowchart (process diagram) statistical process control chart check sheet pareto chart cause-and-effect diagram scatter diagram Please copy and paste data from text area below. Selected delimiter: Tab Done Please copy and paste data from text area below. Selected delimiter: Semicolon - Customer Number (i); Minutes from Time Food Ordered Until Food Arrived (yi);No. of Trips to ki. 1;10.25;42;8.75;33;8.00;34;5.00;15;6.00;26;13.00;57;15.00;6 Done Kathleen McFadden's restaurant in Boston, has recorded the following data for eight recent customers: a) Kathleen wants you to graph the eight points (xi,yi),i=1,2,,8. She has been concerned because customers have been waiting too long for their food, and this graph is intended to help her find possible causes of the problem. Selected delimiter: Customer Number (i), Minutes from Time Food Ordered Until Food Arrived (yi), No. of Trips to ki.A 1,10.25,4 2,8.75,3 3,8.00,3 4,5.00,1 5,6.00,2 6,13.00,5 7,15.00,6 4 Please copy and paste data from text area below. Selected delimiter: \( \begin{array}{ll}\text { Customer_Number_(i) Minutes_from_Time_Food_Ordered_Until_Food_Arrived_(yi) No._of_Trips_to_ki } \\ 1 & 10.254 \\ 2 & 8.753 \\ 3 & 8.003 \\ 4 & 5.001 \\ 5 & 6.002 \\ 6 & 13.005 \\ 7 & 15.006\end{array} \)
Step by Step Solution
There are 3 Steps involved in it

Get step-by-step solutions from verified subject matter experts