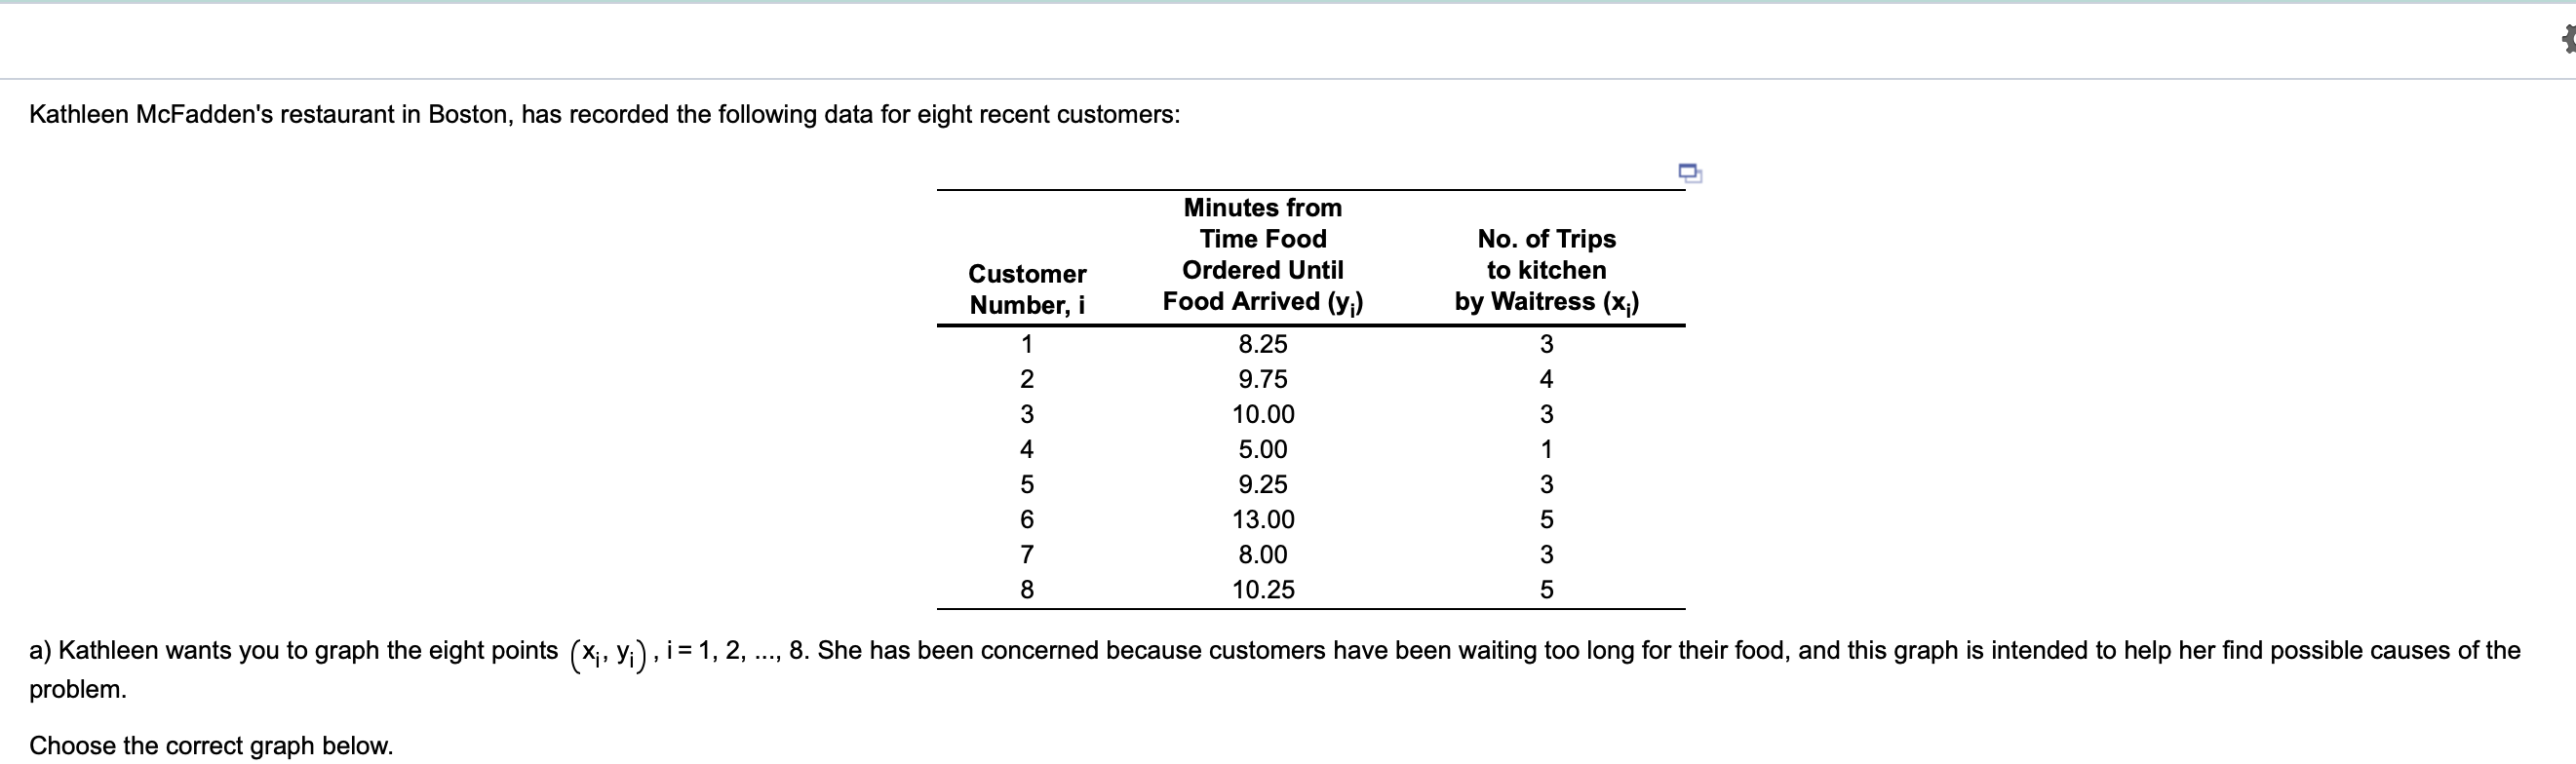
Question: Please help me check if i did it right, please explain it thanks Kathleen McFadden's restaurant in Boston, has recorded the following data for eight

Please help me check if i did it right, please

Please help me check if i did it right, pleasePlease help me check if i did it right, please explain it thanks

Kathleen McFadden's restaurant in Boston, has recorded the following data for eight recent customers: Customer Number, i 1 Minutes from Time Food Ordered Until Food Arrived (y;) 8.25 9.75 10.00 5.00 9.25 13.00 8.00 10.25 No. of Trips to kitchen by Waitress (x;) 3 4 3 2 3 4 | 5 6 7 8 a) Kathleen wants you to graph the eight points (xi, Yi), i = 1, 2, ..., 8. She has been concerned because customers have been waiting too long for their food, and this graph is intended to help her find possible causes of the problem. Choose the correct graph below. O A. OB O C. OD. + 15 . Time (min) 10- No. of Trips to Kitchen 0 Time (min) IIIII 00 Time (min) N 4 5+ N 15 10 Time (min) No. of Trips to Kitchen b) This is an example of what type of graph? statistical process control chart 0 flowchart (process diagram) histogram cause-and-effect diagram scatter diagram O 0 check sheet pareto chart

Step by Step Solution

There are 3 Steps involved in it

1 Expert Approved Answer
Step: 1 Unlock blur-text-image
Question Has Been Solved by an Expert!

Get step-by-step solutions from verified subject matter experts

Step: 2 Unlock
Step: 3 Unlock

Students Have Also Explored These Related General Management Questions!