

Question: A B D E F G H J K 1 2 Correlation Matrix 10-year zero coupon T 10-year zero coupon TB 1 Dollar/Euro SP500 Dollar/Euro
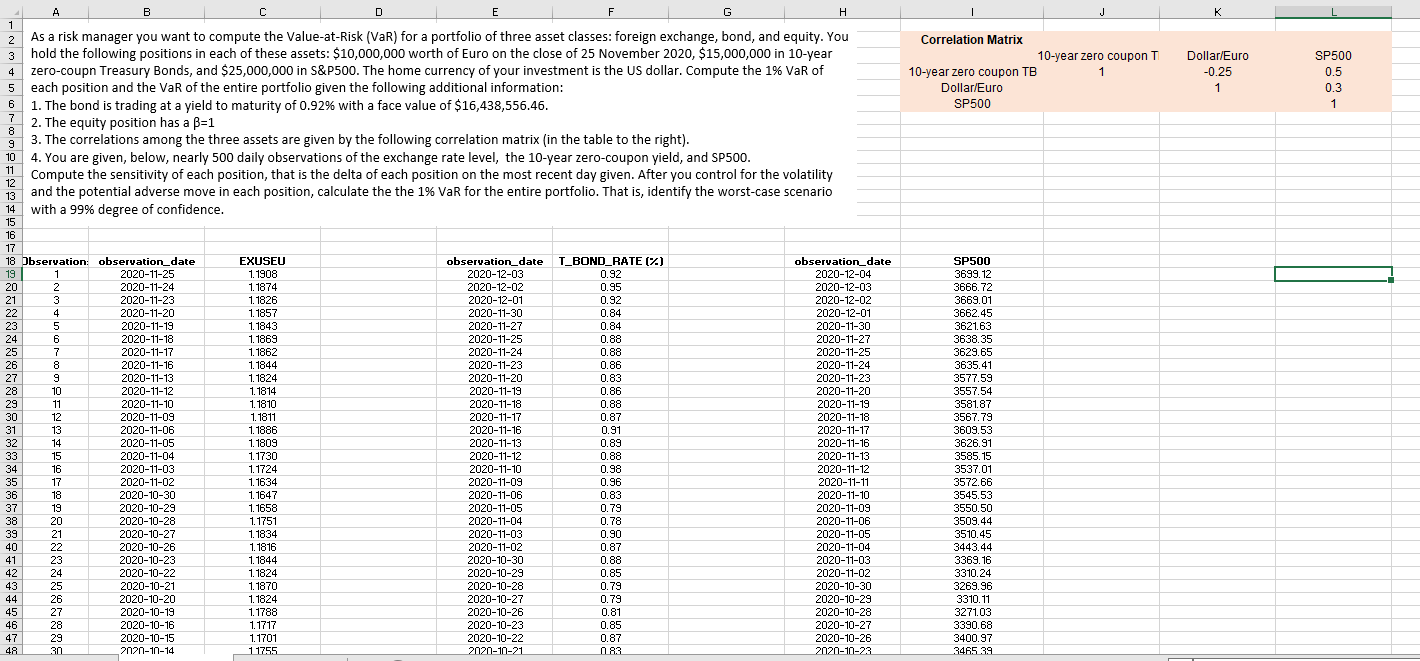
A B D E F G H J K 1 2 Correlation Matrix 10-year zero coupon T 10-year zero coupon TB 1 Dollar/Euro SP500 Dollar/Euro -0.25 1 SP500 0.5 0.3 1 As a risk manager you want to compute the Value-at-Risk (VaR) for a portfolio of three asset classes: foreign exchange, bond, and equity. You hold the following positions in each of these assets: $10,000,000 worth of Euro on the close of 25 November 2020, $15,000,000 in 10-year 4 zero-coupn Treasury Bonds, and $25,000,000 in S&P500. The home currency of your investment is the US dollar. Compute the 1% VaR of 5 each position and the VaR of the entire portfolio given the following additional information: 6 1. The bond is trading at a yield to maturity of 0.92% with a face value of $16,438,556.46. 2. The equity position has a B=1 3. The correlations among the three assets are given by the following correlation matrix (in the table to the right). 4. You are given, below, nearly 500 daily observations of the exchange rate level, the 10-year zero-coupon yield, and SP500. Compute the sensitivity of each position, that is the delta of each position on the most recent day given. After you control for the volatility and the potential adverse move in each position, calculate the the 1% VaR for the entire portfolio. That is, identify the worst-case scenario with a 99% degree of confidence. 6 7 8 9 10 11 12 13 14 15 16 17 18 Observation: observation_date 19 1 2020-11-25 20 2 2 2020-11-24 21 3 2020-11-23 22 4 2020-11-20 23 5 2020-11-18 24 6 2020-11-18 25 7 2020-11-17 26 8 2020-11-16 27 9 9 2020-11-13 28 10 2020-11-12 29 11 2020-11-10 30 12 2020-11-09 31 13 2020-11-06 32 14 2020-11-05 33 15 2020-11-04 34 16 2020-11-03 35 17 2020-11-02 36 18 2020-10-30 37 19 2020-10-29 38 20 2020-10-28 39 21 2020-10-27 40 22 2020-10-26 41 23 2020-10-23 42 24 2020-10-22 43 25 2020-10-21 44 26 2020-10-20 45 27 2020-10-19 46 28 2020-10-16 47 29 2020-10-15 48 30 2020-10-14 EXUSEU 1.1908 1.1874 1. 1826 1. 1857 1. 1843 1.1869 1. 1862 1. 1844 1. 1824 1. 1814 1. 1810 1. 1811 1.1886 1.1809 1.1730 1.1724 1.1634 1.1647 1.1658 1.1751 1.1834 1. 1816 1.1844 1.1824 1. 1870 1. 1824 1.1788 1.1717 1.1701 11755 observation_date 2020-12-03 2020-12-02 2020-12-01 2020-11-30 2020-11-27 2020-11-25 2020-11-24 2020-11-23 2020-11-20 2020-11-19 2020-11-18 2020-11-17 2020-11-16 2020-11-13 2020-11-12 2020-11-10 2020-11-09 2020-11-06 2020-11-05 2020-11-04 2020-11-03 2020-11-02 2020-10-30 2020-10-29 2020-10-28 2020-10-27 2020-10-26 2020-10-23 2020-10-22 2020-10-21 T_BOND_RATE (%) 0.92 0.95 0.92 0.84 0.84 0.88 0.88 0.86 0.83 0.86 0.88 0.87 0.91 0.89 0.88 0.98 0.96 0.83 0.79 0.78 0.90 0.87 0.88 0.85 0.79 0.79 0.81 0.85 0.87 183 observation_date 2020-12-04 2020-12-03 2020-12-02 2020-12-01 2020-11-30 2020-11-27 2020-11-25 2020-11-24 2020-11-23 2020-11-20 2020-11-19 2020-11-18 2020-11-17 2020-11-16 2020-11-13 2020-11-12 2020-11-11 2020-11-10 2020-11-09 2020-11-06 2020-11-05 2020-11-04 2020-11-03 2020-11-02 2020-10-30 2020-10-29 2020-10-28 2020-10-27 2020-10-26 2020-10-23 SP500 3699.12 3666.72 3669.01 3662.45 362163 3638.35 3629.65 3635.41 3577.59 3557.54 3581.87 3567.79 3609.53 3626.91 3585.15 3537.01 3572.66 3545.53 3550.50 3509.44 3510.45 3443.44 3369.16 3310.24 3269.96 3310.11 3271.03 3390.68 3400.97 3465 39 A B D E F G H J K 1 2 Correlation Matrix 10-year zero coupon T 10-year zero coupon TB 1 Dollar/Euro SP500 Dollar/Euro -0.25 1 SP500 0.5 0.3 1 As a risk manager you want to compute the Value-at-Risk (VaR) for a portfolio of three asset classes: foreign exchange, bond, and equity. You hold the following positions in each of these assets: $10,000,000 worth of Euro on the close of 25 November 2020, $15,000,000 in 10-year 4 zero-coupn Treasury Bonds, and $25,000,000 in S&P500. The home currency of your investment is the US dollar. Compute the 1% VaR of 5 each position and the VaR of the entire portfolio given the following additional information: 6 1. The bond is trading at a yield to maturity of 0.92% with a face value of $16,438,556.46. 2. The equity position has a B=1 3. The correlations among the three assets are given by the following correlation matrix (in the table to the right). 4. You are given, below, nearly 500 daily observations of the exchange rate level, the 10-year zero-coupon yield, and SP500. Compute the sensitivity of each position, that is the delta of each position on the most recent day given. After you control for the volatility and the potential adverse move in each position, calculate the the 1% VaR for the entire portfolio. That is, identify the worst-case scenario with a 99% degree of confidence. 6 7 8 9 10 11 12 13 14 15 16 17 18 Observation: observation_date 19 1 2020-11-25 20 2 2 2020-11-24 21 3 2020-11-23 22 4 2020-11-20 23 5 2020-11-18 24 6 2020-11-18 25 7 2020-11-17 26 8 2020-11-16 27 9 9 2020-11-13 28 10 2020-11-12 29 11 2020-11-10 30 12 2020-11-09 31 13 2020-11-06 32 14 2020-11-05 33 15 2020-11-04 34 16 2020-11-03 35 17 2020-11-02 36 18 2020-10-30 37 19 2020-10-29 38 20 2020-10-28 39 21 2020-10-27 40 22 2020-10-26 41 23 2020-10-23 42 24 2020-10-22 43 25 2020-10-21 44 26 2020-10-20 45 27 2020-10-19 46 28 2020-10-16 47 29 2020-10-15 48 30 2020-10-14 EXUSEU 1.1908 1.1874 1. 1826 1. 1857 1. 1843 1.1869 1. 1862 1. 1844 1. 1824 1. 1814 1. 1810 1. 1811 1.1886 1.1809 1.1730 1.1724 1.1634 1.1647 1.1658 1.1751 1.1834 1. 1816 1.1844 1.1824 1. 1870 1. 1824 1.1788 1.1717 1.1701 11755 observation_date 2020-12-03 2020-12-02 2020-12-01 2020-11-30 2020-11-27 2020-11-25 2020-11-24 2020-11-23 2020-11-20 2020-11-19 2020-11-18 2020-11-17 2020-11-16 2020-11-13 2020-11-12 2020-11-10 2020-11-09 2020-11-06 2020-11-05 2020-11-04 2020-11-03 2020-11-02 2020-10-30 2020-10-29 2020-10-28 2020-10-27 2020-10-26 2020-10-23 2020-10-22 2020-10-21 T_BOND_RATE (%) 0.92 0.95 0.92 0.84 0.84 0.88 0.88 0.86 0.83 0.86 0.88 0.87 0.91 0.89 0.88 0.98 0.96 0.83 0.79 0.78 0.90 0.87 0.88 0.85 0.79 0.79 0.81 0.85 0.87 183 observation_date 2020-12-04 2020-12-03 2020-12-02 2020-12-01 2020-11-30 2020-11-27 2020-11-25 2020-11-24 2020-11-23 2020-11-20 2020-11-19 2020-11-18 2020-11-17 2020-11-16 2020-11-13 2020-11-12 2020-11-11 2020-11-10 2020-11-09 2020-11-06 2020-11-05 2020-11-04 2020-11-03 2020-11-02 2020-10-30 2020-10-29 2020-10-28 2020-10-27 2020-10-26 2020-10-23 SP500 3699.12 3666.72 3669.01 3662.45 362163 3638.35 3629.65 3635.41 3577.59 3557.54 3581.87 3567.79 3609.53 3626.91 3585.15 3537.01 3572.66 3545.53 3550.50 3509.44 3510.45 3443.44 3369.16 3310.24 3269.96 3310.11 3271.03 3390.68 3400.97 3465 39
Step by Step Solution
There are 3 Steps involved in it

Get step-by-step solutions from verified subject matter experts