

Question: A B D E F H . J L M N The table shows the indicators of the cash flows of the investment project for
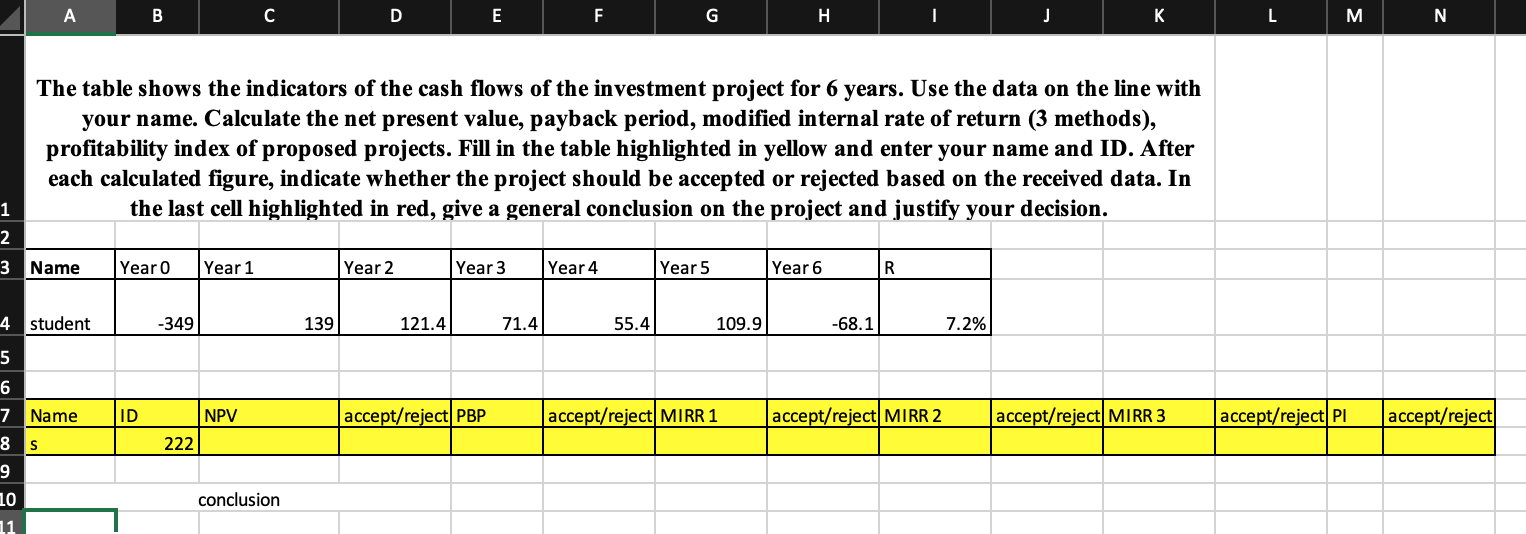
A B D E F H . J L M N The table shows the indicators of the cash flows of the investment project for 6 years. Use the data on the line with your name. Calculate the net present value, payback period, modified internal rate of return (3 methods), profitability index of proposed projects. Fill in the table highlighted in yellow and enter your name and ID. After each calculated figure, indicate whether the project should be accepted or rejected based on the received data. In the last cell highlighted in red, give a general conclusion on the project and justify your decision. 1 2 3 Name Year 0 Year 1 Year 2 Year 3 Year 4 Year 5 Year 6 R 4. student -349 139 121.4 71.4 55.4 109.9 -68.1 7.2% 5 6 7 Name ID NPV accept/reject PBP accept/reject MIRR 1 accept/reject MIRR 2 accept/reject MIRR 3 accept/reject P1 accept/reject 8 S 222 9 conclusion 10 11 A B D E F H . J L M N The table shows the indicators of the cash flows of the investment project for 6 years. Use the data on the line with your name. Calculate the net present value, payback period, modified internal rate of return (3 methods), profitability index of proposed projects. Fill in the table highlighted in yellow and enter your name and ID. After each calculated figure, indicate whether the project should be accepted or rejected based on the received data. In the last cell highlighted in red, give a general conclusion on the project and justify your decision. 1 2 3 Name Year 0 Year 1 Year 2 Year 3 Year 4 Year 5 Year 6 R 4. student -349 139 121.4 71.4 55.4 109.9 -68.1 7.2% 5 6 7 Name ID NPV accept/reject PBP accept/reject MIRR 1 accept/reject MIRR 2 accept/reject MIRR 3 accept/reject P1 accept/reject 8 S 222 9 conclusion 10 11
Step by Step Solution
There are 3 Steps involved in it

Get step-by-step solutions from verified subject matter experts