

Question: A B E F b 2) Using Pivot Table to derive the information of Business Type - Apartment across timeline a Calculate monthly average in
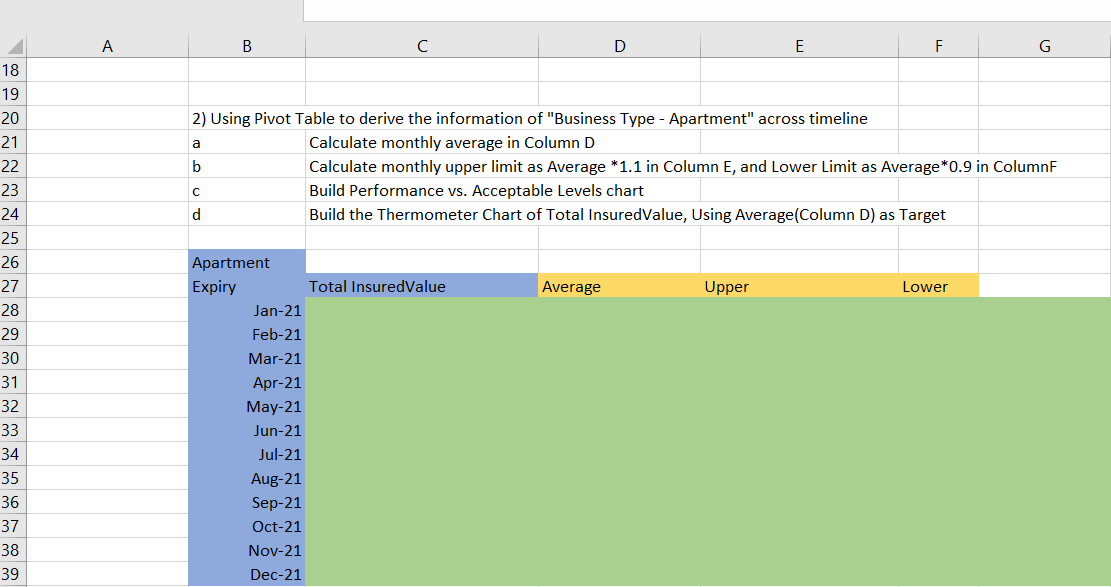
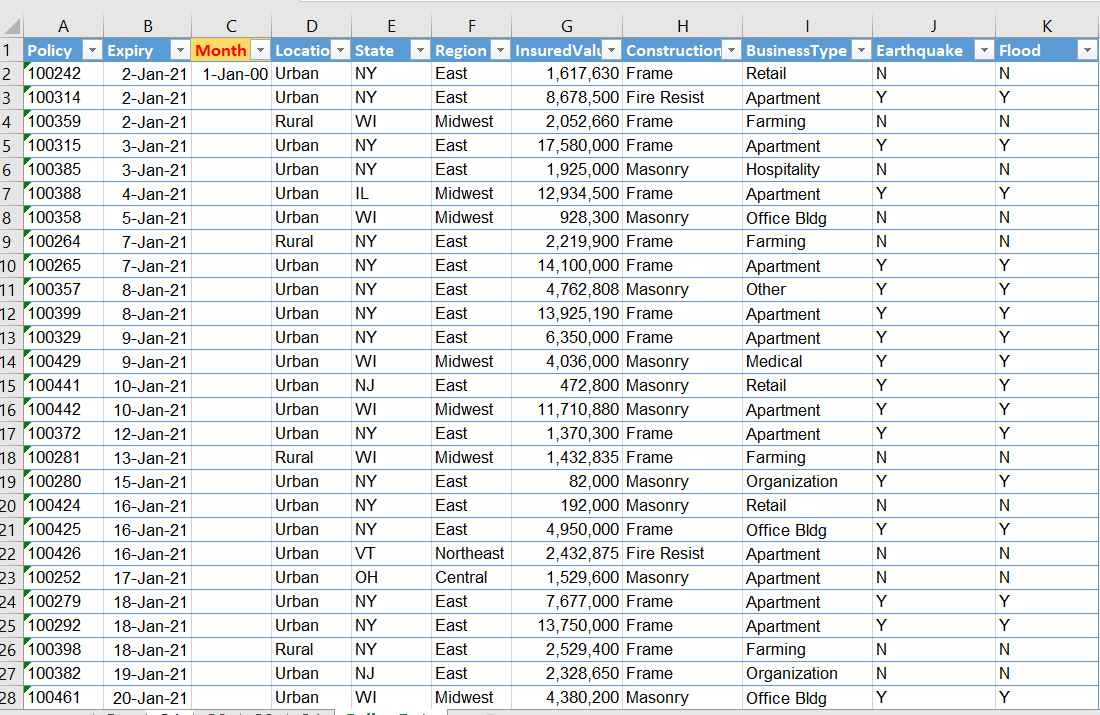
A B E F b 2) Using Pivot Table to derive the information of "Business Type - Apartment" across timeline a Calculate monthly average in Column D Calculate monthly upper limit as Average *1.1 in Column E, and Lower Limit as Average*0.9 in Column Build Performance vs. Acceptable Levels chart d Build the Thermometer Chart of Total InsuredValue, Using Average(Column D) as Target Average Upper Lower 18 19 20 21 22 23 24 25 26 27 28 29 30 31 32 33 34 35 36 37 38 39 Apartment Expiry Total InsuredValue Jan-21 Feb-21 Mar-21 Apr-21 May-21 Jun-21 Jul-21 Aug-21 Sep-21 Oct-21 Nov-21 Dec-21 n A B D E 1 Policy Expiry Month Locatio State 2 100242 2-Jan-21 1-Jan-00 Urban NY 3 100314 2-Jan-21 Urban 4 100359 2-Jan-21 Rural WI 5 100315 3-Jan-21 Urban NY 6 100385 3-Jan-21 Urban NY 7 100388 4-Jan-21 Urban IL 8 100358 5-Jan-21 Urban WI 9 100264 7-Jan-21 Rural 10 100265 7-Jan-21 Urban NY 11 100357 8-Jan-21 Urban 12 100399 8-Jan-21 Urban 13 100329 9-Jan-21 Urban NY 14 100429 9-Jan-21 Urban WI 15 100441 10-Jan-21 Urban NJ 16 100442 10-Jan-21 Urban WI 17 100372 12-Jan-21 Urban NY 18 100281 13-Jan-21 Rural WI 19 100280 15-Jan-21 Urban NY 20 100424 16-Jan-21 Urban NY 21 100425 16-Jan-21 Urban NY 22 100426 16-Jan-21 Urban VT 23 100252 17-Jan-21 Urban OH 24 100279 18-Jan-21 Urban NY 25 100292 18-Jan-21 Urban NY 26 100398 18-Jan-21 Rural 27 100382 19-Jan-21 Urban NJ 28 100461 20-Jan-21 Urban WI WWW MM L|WWWWWWWMWWWWWWWWMWMW F Region East East Midwest East East Midwest Midwest East East East East East Midwest East Midwest East Midwest East East East Northeast Central East East East East Midwest G H K InsuredVal Construction Business Type Earthquake Flood 1,617,630 Frame Retail N N 8,678,500 Fire Resist Apartment Y Y 2,052,660 Frame Farming N N 17,580,000 Frame Apartment Y Y 1,925,000 Masonry Hospitality N N 12,934,500 Frame Apartment Y Y 928,300 Masonry Office Bldg N N 2,219,900 Frame Farming N N 14,100,000 Frame Apartment Y Y 4,762,808 Masonry Other Y Y 13,925, 190 Frame Apartment Y Y 6,350,000 Frame Apartment Y Y 4,036,000 Masonry Medical Y Y 472,800 Masonry Retail Y Y 11,710,880 Masonry Apartment Y Y 1,370,300 Frame Apartment Y Y 1,432,835 Frame Farming N N 82,000 Masonry Organization Y Y 192,000 Masonry Retail N N 4,950,000 Frame Office Bldg Y Y 2,432,875 Fire Resist Apartment N N 1,529,600 Masonry Apartment N N 7,677,000 Frame Apartment Y Y 13,750,000 Frame Apartment Y Y 2,529,400 Frame Farming N N 2,328,650 Frame Organization N N 4,380,200 Masonry Office Bldg Y Y A B E F b 2) Using Pivot Table to derive the information of "Business Type - Apartment" across timeline a Calculate monthly average in Column D Calculate monthly upper limit as Average *1.1 in Column E, and Lower Limit as Average*0.9 in Column Build Performance vs. Acceptable Levels chart d Build the Thermometer Chart of Total InsuredValue, Using Average(Column D) as Target Average Upper Lower 18 19 20 21 22 23 24 25 26 27 28 29 30 31 32 33 34 35 36 37 38 39 Apartment Expiry Total InsuredValue Jan-21 Feb-21 Mar-21 Apr-21 May-21 Jun-21 Jul-21 Aug-21 Sep-21 Oct-21 Nov-21 Dec-21 n A B D E 1 Policy Expiry Month Locatio State 2 100242 2-Jan-21 1-Jan-00 Urban NY 3 100314 2-Jan-21 Urban 4 100359 2-Jan-21 Rural WI 5 100315 3-Jan-21 Urban NY 6 100385 3-Jan-21 Urban NY 7 100388 4-Jan-21 Urban IL 8 100358 5-Jan-21 Urban WI 9 100264 7-Jan-21 Rural 10 100265 7-Jan-21 Urban NY 11 100357 8-Jan-21 Urban 12 100399 8-Jan-21 Urban 13 100329 9-Jan-21 Urban NY 14 100429 9-Jan-21 Urban WI 15 100441 10-Jan-21 Urban NJ 16 100442 10-Jan-21 Urban WI 17 100372 12-Jan-21 Urban NY 18 100281 13-Jan-21 Rural WI 19 100280 15-Jan-21 Urban NY 20 100424 16-Jan-21 Urban NY 21 100425 16-Jan-21 Urban NY 22 100426 16-Jan-21 Urban VT 23 100252 17-Jan-21 Urban OH 24 100279 18-Jan-21 Urban NY 25 100292 18-Jan-21 Urban NY 26 100398 18-Jan-21 Rural 27 100382 19-Jan-21 Urban NJ 28 100461 20-Jan-21 Urban WI WWW MM L|WWWWWWWMWWWWWWWWMWMW F Region East East Midwest East East Midwest Midwest East East East East East Midwest East Midwest East Midwest East East East Northeast Central East East East East Midwest G H K InsuredVal Construction Business Type Earthquake Flood 1,617,630 Frame Retail N N 8,678,500 Fire Resist Apartment Y Y 2,052,660 Frame Farming N N 17,580,000 Frame Apartment Y Y 1,925,000 Masonry Hospitality N N 12,934,500 Frame Apartment Y Y 928,300 Masonry Office Bldg N N 2,219,900 Frame Farming N N 14,100,000 Frame Apartment Y Y 4,762,808 Masonry Other Y Y 13,925, 190 Frame Apartment Y Y 6,350,000 Frame Apartment Y Y 4,036,000 Masonry Medical Y Y 472,800 Masonry Retail Y Y 11,710,880 Masonry Apartment Y Y 1,370,300 Frame Apartment Y Y 1,432,835 Frame Farming N N 82,000 Masonry Organization Y Y 192,000 Masonry Retail N N 4,950,000 Frame Office Bldg Y Y 2,432,875 Fire Resist Apartment N N 1,529,600 Masonry Apartment N N 7,677,000 Frame Apartment Y Y 13,750,000 Frame Apartment Y Y 2,529,400 Frame Farming N N 2,328,650 Frame Organization N N 4,380,200 Masonry Office Bldg Y Y
Step by Step Solution
There are 3 Steps involved in it

Get step-by-step solutions from verified subject matter experts