

Question: A B E F G K L Problem 10-1 Complete the steps below using cell references to given data or previous calculations. In some cases,
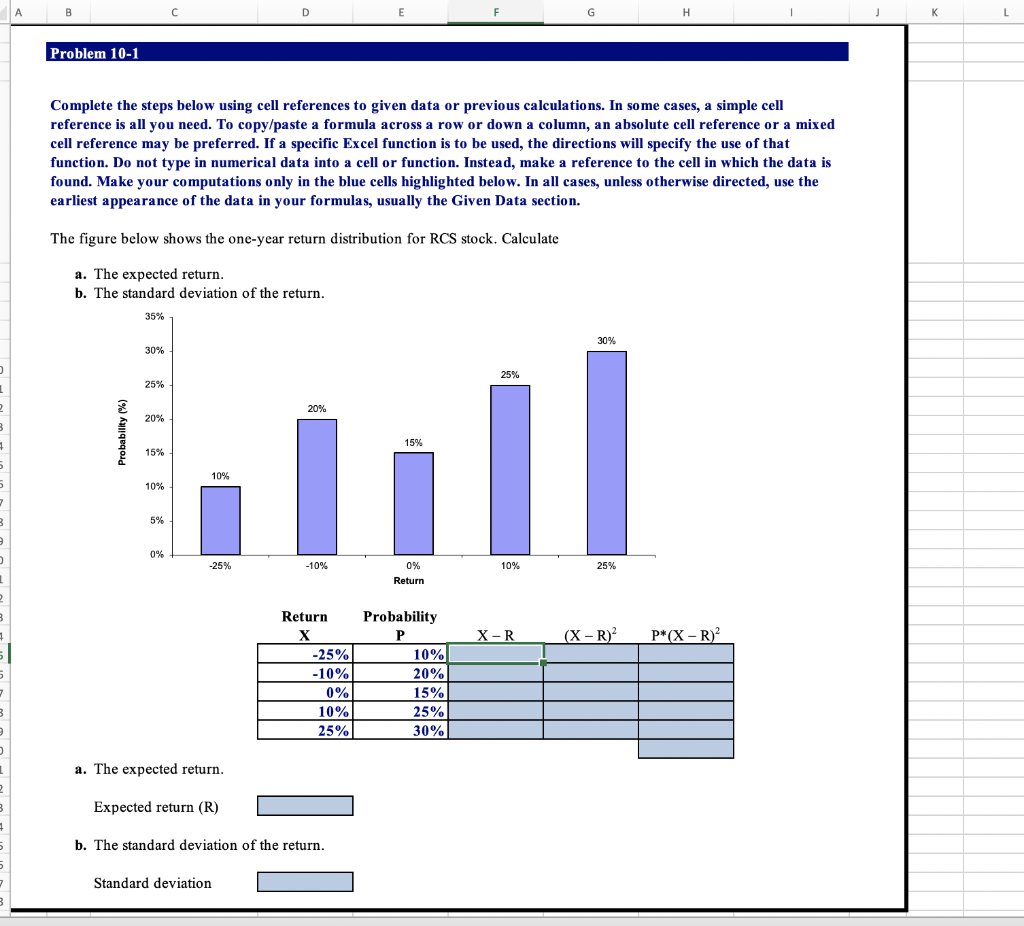
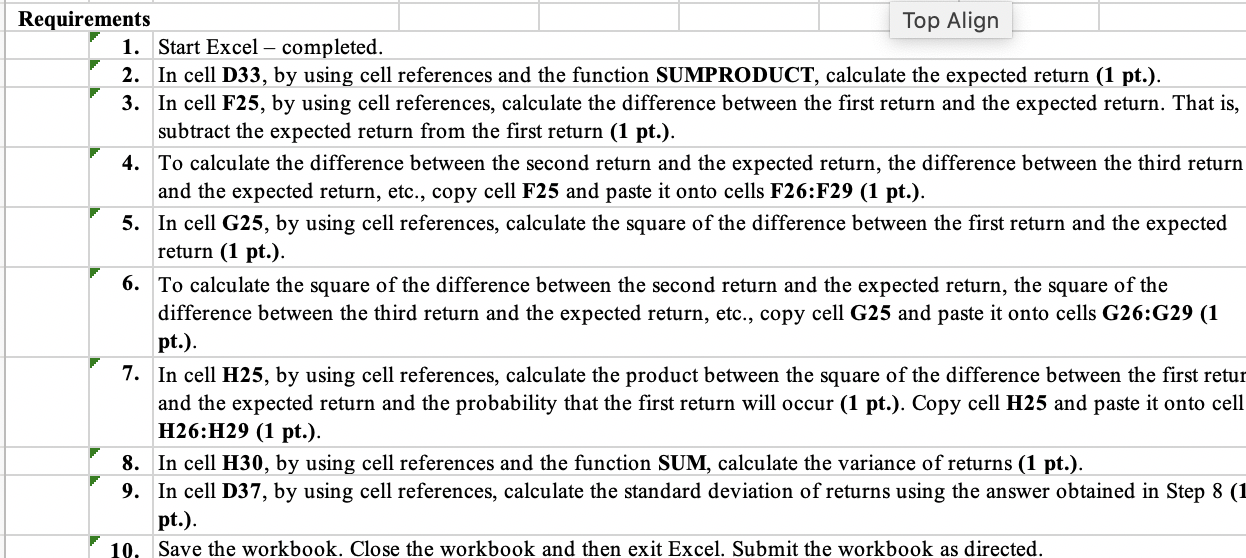
A B E F G K L Problem 10-1 Complete the steps below using cell references to given data or previous calculations. In some cases, a simple cell reference is all you need. To copy/paste a formula across a row or down a column, an absolute cell reference or a mixed cell reference may be preferred. If a specific Excel function is to be used, the directions will specify the use of that function. Do not type in numerical data into a cell or function. Instead, make a reference to the cell in which the data is found. Make your computations only in the blue cells highlighted below. In all cases, unless otherwise directed, use the earliest appearance of the data in your formulas, usually the Given Data section. The figure below shows the one-year return distribution for RCS stock. Calculate a. The expected return. b. The standard deviation of the return. 35% 30% 30% 25% 25% 1 2 20% 20% 3 Probability (%) 15% 15% 5 10% 10% 7 3 5% 0% -25% -10% 0% 10% 25% Return 2 3 X-R (X-R) P*(X-R) 5 Return X -25% -10% 0% 10% 25% Probability P 10% 20% 15% 25% 30% 7 3 a. The expected return. 2 3 Expected return (R) b. The standard deviation of the return 5 7 Standard deviation 3 Requirements Top Align 1. Start Excel - completed. 2. In cell D33, by using cell references and the function SUMPRODUCT, calculate the expected return (1 pt.). 3. In cell F25, by using cell references, calculate the difference between the first return and the expected return. That is, subtract the expected return from the first return (1 pt.). 4. To calculate the difference between the second return and the expected return, the difference between the third return and the expected return, etc., copy cell F25 and paste it onto cells F26:F29 (1 pt.). 5. In cell G25, by using cell references, calculate the square of the difference between the first return and the expected return (1 pt.). 6. To calculate the square of the difference between the second return and the expected return, the square of the difference between the third return and the expected return, etc., copy cell G25 and paste it onto cells G26:G29 (1 pt.). 7. In cell H25, by using cell references, calculate the product between the square of the difference between the first retur and the expected return and the probability that the first return will occur (1 pt.). Copy cell H25 and paste it onto cell H26:H29 (1 pt.). 8. In cell H30, by using re ences and the function SUM, calculate the variance of returns (1 pt.). 9. In cell D37, by using cell references, calculate the standard deviation of returns using the answer obtained in Step 8 (1 pt.). 10. Save the workbook. Close the workbook and then exit Excel. Submit the workbook as directed
Step by Step Solution
There are 3 Steps involved in it

Get step-by-step solutions from verified subject matter experts