

Question: Problem 6-25 Complete the steps below using cell references to given data or previous calculations. In some cases, a simple cell reference is all you
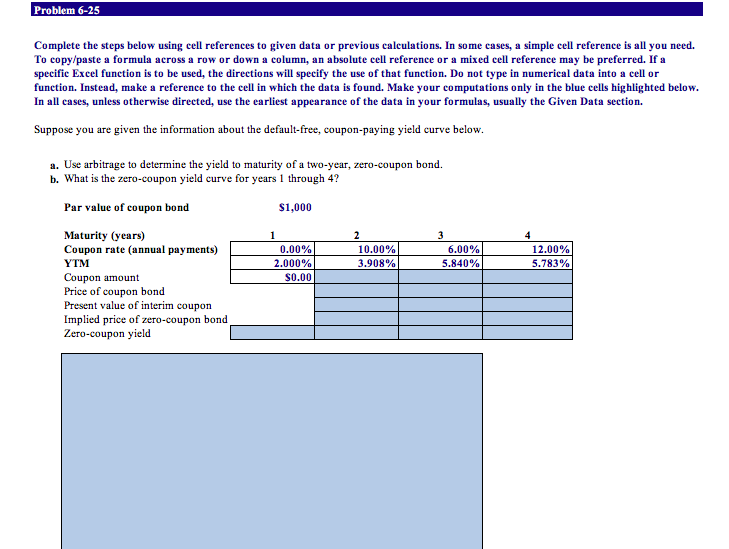
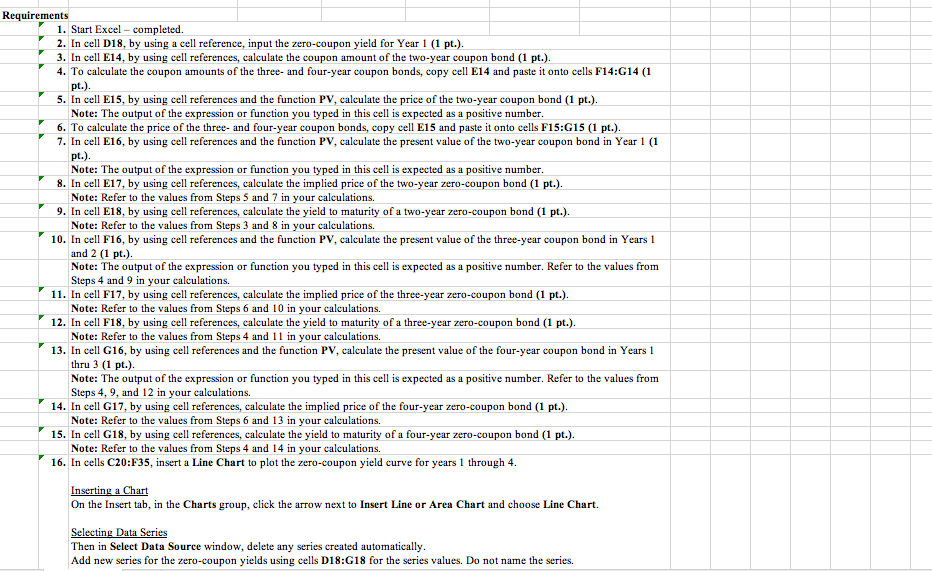
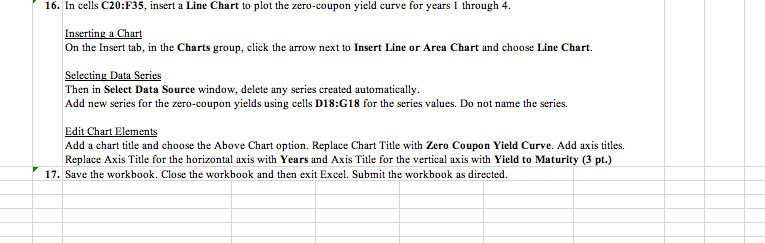
Problem 6-25 Complete the steps below using cell references to given data or previous calculations. In some cases, a simple cell reference is all you need. To copy/paste a formula across a row or down a column, an absolute cell reference or a mixed cell reference may be preferred. If a specific Excel function is to be used, the directions will specify the use of that function. Do not type in numerical data into a cell or function. Instead, make a reference to the cell in which the data is found. Make your computations only in the blue cells highlighted below. In all cases, unless otherwise directed, use the earliest appearance of the data in your formulas, usually the Given Data section. Suppose you are given the information about the default-free, coupon-paying yield curve below. 1 2 a. Use arbitrage to determine the yield to maturity of a two-year, zero-coupon bond. b. What is the zero-coupon yield curve for years 1 through 4? Par value of coupon bond $1,000 Maturity (years) Coupon rate (annual payments) 0.00% 10.00% YTM 2.000% 3.908% 5.840% Coupon amount $0.00 Price of coupon bond Present value of interim coupon Implied price of zero-coupon bond Zero-coupon yield 3 6.00% 4 12.00% 5.783% Requirements 1. Start Excel - completed. 2. In cell D18, by using a cell reference, input the zero-coupon yield for Year 1 (1 pt.). 3. In cell E14, by using cell references, calculate the coupon amount of the two-year coupon bond (1 pt.). 4. To calculate the coupon amounts of the three- and four-year coupon bonds, copy cell E14 and paste it onto cells F14:G14 (1 pt.). 5. In cell E15, by using cell references and the function PV, calculate the price of the two-year coupon bond (1 pt.). Note: The output of the expression or function you typed in this cell is expected as a positive number. 6. To calculate the price of the three- and four-year coupon bonds, copy cell E15 and paste it onto cells F15:G15 (1 pt.). 7. In cell E16, by using cell references and the function PV, calculate the present value of the two-year coupon bond in Year 1 (1 pt.). Note: The output of the expression or function you typed in this cell is expected as a positive number. 8. In cell E17, by using cell references, calculate the implied price of the two-year zero-coupon bond (1 pt.). Note: Refer to the values from Steps 5 and 7 in your calculations. 9. In cell E18, by using cell references, calculate the yield to maturity of a two-year zero-coupon bond (1 pt.). Note: Refer to the values from Steps 3 and 8 in your calculations. 10. In cell F16, by using cell references and the function PV, calculate the present value of the three-year coupon bond in Years 1 and 2 (1 pt.). Note: The output of the expression or function you typed in this cell is expected as a positive number. Refer to the values from Steps 4 and 9 in your calculations. 11. In cell F17, by using cell references, calculate the implied price of the three-year zero-coupon bond (1 pt.). Note: Refer to the values from Steps 6 and 10 in your calculations. 12. In cell F18, by using cell references, calculate the yield to maturity of a three-year zero-coupon bond (1 pt.). Note: Refer to the values from Steps 4 and 11 in your calculations. 13. In cell G16, by using cell references and the function PV, calculate the present value of the four-year coupon bond in Years 1 thru 3 (1 pt.) Note: The output of the expression or function you typed in this cell is expected as a positive number. Refer to the values from Steps 4, 9, and 12 in your calculations. 14. In cell G17, by using cell references, calculate the implied price of the four-year zero-coupon bond (1 pt.). Note: Refer to the values from Steps 6 and 13 in your calculations. 15. In cell G18, by using cell references, calculate the yield to maturity of a four-year zero-coupon bond (1 pt.). Note: Refer to the values from Steps 4 and 14 in your calculations. 16. In cells C20:F35, insert a Line Chart to plot the zero-coupon yield curve for years 1 through 4. Inserting a Chart On the Insert tab, in the Charts group, click the arrow next to Insert Line or Area Chart and choose Line Chart Selecting Data Series Then in Select Data Source window, delete any series created automatically. Add new series for the zero-coupon yields using cells D18:518 for the series values. Do not name the series. 16. In cells C20:F35, insert a Line Chart to plot the zero-coupon yield curve for years 1 through 4. Inserting a Chart On the Insert tab, in the Charts group, click the arrow next to Insert Line or Area Chart and choose Line Chart. Selecting Data Series Then in Select Data Source window, delete any series created automatically. Add new series for the zero-coupon yields using cells D18:518 for the series values. Do not name the series. Edit Chart Elements Add a chart title and choose the Above Chart option. Replace Chart Title with Zero Coupon Yield Curve. Add axis titles. Replace Axis Title for the horizontal axis with Years and Axis Title for the vertical axis with Yield to Maturity (3 pt.) 17. Save the workbook. Close the workbook and then exit Excel. Submit the workbook as directed. Problem 6-25 Complete the steps below using cell references to given data or previous calculations. In some cases, a simple cell reference is all you need. To copy/paste a formula across a row or down a column, an absolute cell reference or a mixed cell reference may be preferred. If a specific Excel function is to be used, the directions will specify the use of that function. Do not type in numerical data into a cell or function. Instead, make a reference to the cell in which the data is found. Make your computations only in the blue cells highlighted below. In all cases, unless otherwise directed, use the earliest appearance of the data in your formulas, usually the Given Data section. Suppose you are given the information about the default-free, coupon-paying yield curve below. 1 2 a. Use arbitrage to determine the yield to maturity of a two-year, zero-coupon bond. b. What is the zero-coupon yield curve for years 1 through 4? Par value of coupon bond $1,000 Maturity (years) Coupon rate (annual payments) 0.00% 10.00% YTM 2.000% 3.908% 5.840% Coupon amount $0.00 Price of coupon bond Present value of interim coupon Implied price of zero-coupon bond Zero-coupon yield 3 6.00% 4 12.00% 5.783% Requirements 1. Start Excel - completed. 2. In cell D18, by using a cell reference, input the zero-coupon yield for Year 1 (1 pt.). 3. In cell E14, by using cell references, calculate the coupon amount of the two-year coupon bond (1 pt.). 4. To calculate the coupon amounts of the three- and four-year coupon bonds, copy cell E14 and paste it onto cells F14:G14 (1 pt.). 5. In cell E15, by using cell references and the function PV, calculate the price of the two-year coupon bond (1 pt.). Note: The output of the expression or function you typed in this cell is expected as a positive number. 6. To calculate the price of the three- and four-year coupon bonds, copy cell E15 and paste it onto cells F15:G15 (1 pt.). 7. In cell E16, by using cell references and the function PV, calculate the present value of the two-year coupon bond in Year 1 (1 pt.). Note: The output of the expression or function you typed in this cell is expected as a positive number. 8. In cell E17, by using cell references, calculate the implied price of the two-year zero-coupon bond (1 pt.). Note: Refer to the values from Steps 5 and 7 in your calculations. 9. In cell E18, by using cell references, calculate the yield to maturity of a two-year zero-coupon bond (1 pt.). Note: Refer to the values from Steps 3 and 8 in your calculations. 10. In cell F16, by using cell references and the function PV, calculate the present value of the three-year coupon bond in Years 1 and 2 (1 pt.). Note: The output of the expression or function you typed in this cell is expected as a positive number. Refer to the values from Steps 4 and 9 in your calculations. 11. In cell F17, by using cell references, calculate the implied price of the three-year zero-coupon bond (1 pt.). Note: Refer to the values from Steps 6 and 10 in your calculations. 12. In cell F18, by using cell references, calculate the yield to maturity of a three-year zero-coupon bond (1 pt.). Note: Refer to the values from Steps 4 and 11 in your calculations. 13. In cell G16, by using cell references and the function PV, calculate the present value of the four-year coupon bond in Years 1 thru 3 (1 pt.) Note: The output of the expression or function you typed in this cell is expected as a positive number. Refer to the values from Steps 4, 9, and 12 in your calculations. 14. In cell G17, by using cell references, calculate the implied price of the four-year zero-coupon bond (1 pt.). Note: Refer to the values from Steps 6 and 13 in your calculations. 15. In cell G18, by using cell references, calculate the yield to maturity of a four-year zero-coupon bond (1 pt.). Note: Refer to the values from Steps 4 and 14 in your calculations. 16. In cells C20:F35, insert a Line Chart to plot the zero-coupon yield curve for years 1 through 4. Inserting a Chart On the Insert tab, in the Charts group, click the arrow next to Insert Line or Area Chart and choose Line Chart Selecting Data Series Then in Select Data Source window, delete any series created automatically. Add new series for the zero-coupon yields using cells D18:518 for the series values. Do not name the series. 16. In cells C20:F35, insert a Line Chart to plot the zero-coupon yield curve for years 1 through 4. Inserting a Chart On the Insert tab, in the Charts group, click the arrow next to Insert Line or Area Chart and choose Line Chart. Selecting Data Series Then in Select Data Source window, delete any series created automatically. Add new series for the zero-coupon yields using cells D18:518 for the series values. Do not name the series. Edit Chart Elements Add a chart title and choose the Above Chart option. Replace Chart Title with Zero Coupon Yield Curve. Add axis titles. Replace Axis Title for the horizontal axis with Years and Axis Title for the vertical axis with Yield to Maturity (3 pt.) 17. Save the workbook. Close the workbook and then exit Excel. Submit the workbook as directed
Step by Step Solution
There are 3 Steps involved in it

Get step-by-step solutions from verified subject matter experts