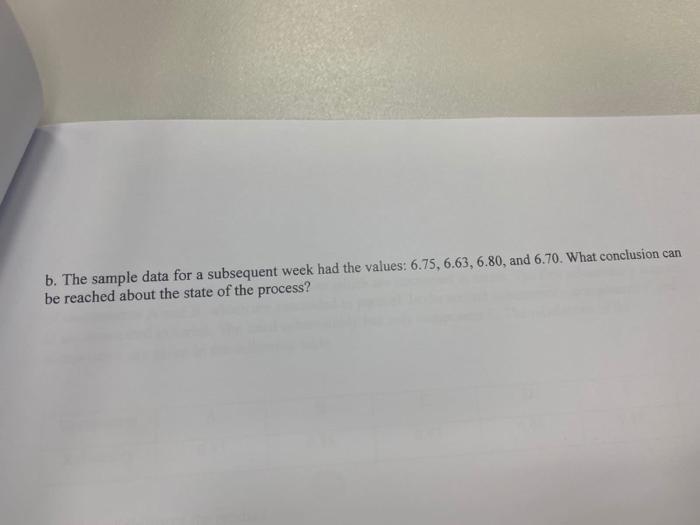
Question: a b. The sample data for a subsequent week had the values: 6.75, 6.63, 6.80, and 6.70. What conclusion can be reached about the state

a b. The sample data for a subsequent week had
a b. The sample data for a subsequent week had the values: 6.75, 6.63, 6.80, and 6.70. What conclusion can be reached about the state of the process? A new machine is set or calibrated to fill tubes of toothpaste at precisely 6.75 ounces. Then, once the machine is running, a sample of 4 tubes is taken every three hours and weighed with the following results: Time Weight of toothpaste (ounces) 6.79 6.77 7 am 6.69 6.76 10 am 6.71 6.73 6.76 6.74 1 pm 6.66 6.67 6.71 6.75 4 pm 6.73 6.72 6.76 6.75 7 pm 6.75 6.75 6.77 6.70 a. Calculate control limits for the range and mean charts, and discuss whether or not the process is in statistical control

Step by Step Solution

There are 3 Steps involved in it

1 Expert Approved Answer
Step: 1 Unlock blur-text-image
Question Has Been Solved by an Expert!

Get step-by-step solutions from verified subject matter experts

Step: 2 Unlock
Step: 3 Unlock

Students Have Also Explored These Related General Management Questions!