

Question: b. The sample data for a subsequent day had the values: 7.1, 11.5, 9.6, and 14.4. What conclusion can be reached about the state of

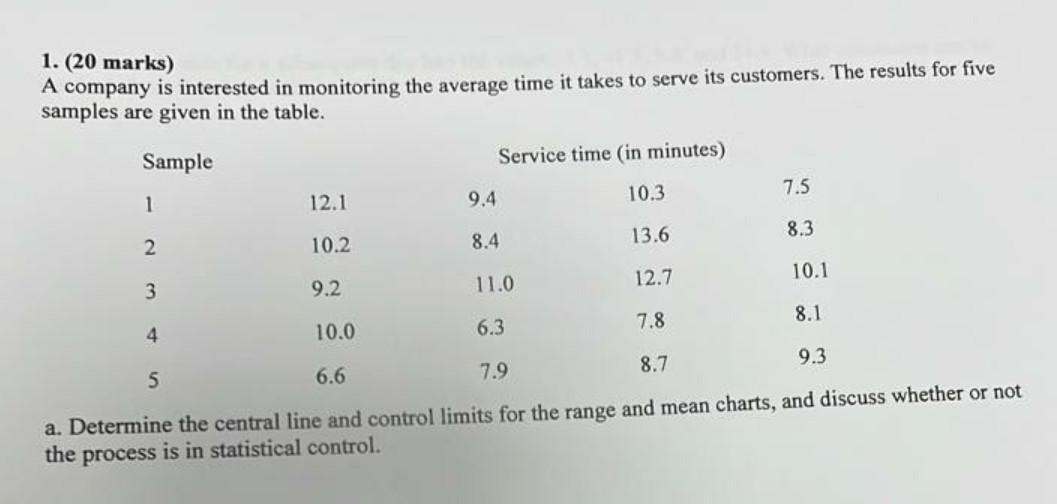
b. The sample data for a subsequent day had the values: 7.1, 11.5, 9.6, and 14.4. What conclusion can be reached about the state of the process? 1. (20 marks) A company is interested in monitoring the average time it takes to serve its customers. The results for five samples are given in the table. Sample Service time (in minutes) 10.3 7.5 1 12.1 2 10.2 13.6 8.4 10.1 12.7 11.0 9.2 3 7.8 8.1 4 10.0 6.3 8.7 9.3 7.9 5 6.6 a. Determine the central line and control limits for the range and mean charts, and discuss whether or not the process is in statistical control. 9.4 8.3
Step by Step Solution
There are 3 Steps involved in it
1 Expert Approved Answer
Step: 1 Unlock

Question Has Been Solved by an Expert!
Get step-by-step solutions from verified subject matter experts
Step: 2 Unlock
Step: 3 Unlock