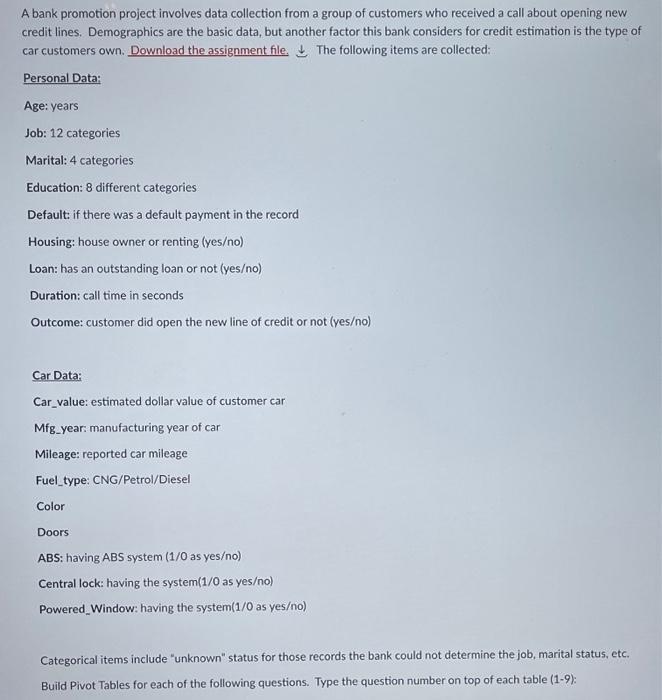
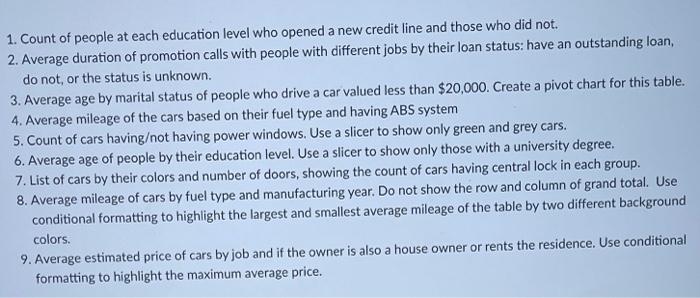
Question: A bank promotion project involves data collection from a group of customers who received a call about opening new credit lines. Demographics are the basic

A bank promotion project involves data collection
A bank promotion project involves data collection from a group of customers who received a call about opening new credit lines. Demographics are the basic data, but another factor this bank considers for credit estimation is the type of car customers own. Download the assignment file. The following items are collected: Personal Data: Age: years Job: 12 categories Marital: 4 categories Education: 8 different categories Default if there was a default payment in the record Housing: house owner or renting (yeso) Loan: has an outstanding loan or not (yeso) Duration: call time in seconds Outcome: customer did open the new line of credit or not (yeso) Car Data: Car_value: estimated dollar value of customer car Mfg_year manufacturing year of car Mileage: reported car mileage Fuel_type: CNG/Petrol/Diesel Color Doors ABS: having ABS system (1/0 as yeso) Central lock: having the system(1/0 as yeso) Powered Window: having the system(1/0 as yeso) Categorical items include "unknown" status for those records the bank could not determine the job, marital status, etc. Build Pivot Tables for each of the following questions. Type the question number on top of each table (1-9): 1. Count of people at each education level who opened a new credit line and those who did not. 2. Average duration of promotion calls with people with different jobs by their loan status: have an outstanding loan, do not, or the status is unknown. 3. Average age by marital status of people who drive a car valued less than $20,000. Create a pivot chart for this table. 4. Average mileage of the cars based on their fuel type and having ABS system 5. Count of cars havingot having power windows. Use a slicer to show only green and grey cars. 6. Average age of people by their education level. Use a slicer to show only those with a university degree. 7. List of cars by their colors and number of doors, showing the count of cars having central lock in each group. 8. Average mileage of cars by fuel type and manufacturing year. Do not show the row and column of grand total. Use conditional formatting to highlight the largest and smallest average mileage of the table by two different background colors. 9. Average estimated price of cars by job and if the owner is also a house owner or rents the residence. Use conditional formatting to highlight the maximum average price. Data Review Insert Formulas View Tell me Draw Page Layout General Calib (Body) 11 - A A Del 33 Wrap Test Merge Center X Out 1 Cory & Format Consonal Format 6 % - 5 BTW A- 1 fx yes B 1 1 + G pied ch 4 will profesion on chool TE Na sert wi ODOSIE 10 FD - w 0001 w che buty Ver Neha ry divine 12 OBCE 2 ng 1 1 TET EN 410 13 PO wp 2122527 EURO ERRORE w 3 waployed Bay 12100 11000 Aaa Aaro PE 22:30 410 1 1 med 19 10 tech 18 ON ulert ce w IT OS cat wy et 18 23 33 24 13 W 1655 9614 12.10 Newheel 33 de Oscar 14 wap ih in NO erat SPSME ht 1 M o to come owing full Concerto four_dows 112 3 1 13750 2011 T2 D 1 43 115 2017 41711 D 1 65 2013 41000 Bil > 1 18 13710 l 1 163 12150 2011 61000 W 2 203 16100 2017 1 94412 3 Gwy + 1 ye 2017 1 son 1 11500 13700 Patrol 2013 1 Red 1 1 105 12350 2011 71138 be 1 2010 11401 2011 ww 1 184 1 1910 3 LEO 1 1 19:00 2011 129 Petrol 257 1 71000 Pro 1 71500 TO 14181 2017 GW 1 1 21 y 2017 107 1 34000 Peel 1 1 16 19 2017 7176 1 1 1 1 714 HO 2017 Grey 2141 Pet 201 16 2017 A Petrol Or 30 376 2011 6140 1 1 16110 2012 410 125 2011 2301 191 2011 . 17 JOL! 210 Pro Grey 104 2011 30 114 > 155 15 2017 BE 25 10 3019 Grey 10 w 3011 48 13 2017 124 15750 2017 19 41 2017 79510 161 2017 2017 GR 13 935 1575 2012 1000 Petrol Grey 1 2011 Pro Grey 140 2017 100 per 1 101 1 157 1011 115 ve 1 25329 Peral 1 14756 31500 Ft 1 100 2017 4101 Petr 1 15 yes 1 16750 1 2011 10 4661 Pare 1 1 12 TES 2012 110404 Red 1 1 65 2013 SOLO 1 1 154 16000 1000 ir D 1 Blue 12315 DE Gry 417 Gwy 1 ro 2011 2 5. JOIT 2018 om 1 15 20500 NIT SP 1 1 HO 310 1 1 1 11100 2011 F D 10 m 1 52 1 1214 1535 Parol 1 re a tudom 47 FE 41415 44141 11070 9 1 10 11 11 PE 45 win it 21 wie 15 M OSSE OSPE DOST E ver Per 41000 5 wa Nahol by NES mu ma PE yes pan 01851 1000 200 wheel 1 ht Yes 1 1 1 w LIGE INES P ba ME SONT 0 * 410 Scala 53 5 OSE re 11 1001 prof 2011 OSE tubes tener serebro 1 1 4 WAR 24 w 2011 Sey ng 112 BE on 0641 OSALE 101 Si 05021 1 FE WE 1570 M WS ITE E VE 27 FE ye 13 36 17 NE TOP 4 13 A bank promotion project involves data collection from a group of customers who received a call about opening new credit lines. Demographics are the basic data, but another factor this bank considers for credit estimation is the type of car customers own. Download the assignment file. The following items are collected: Personal Data: Age: years Job: 12 categories Marital: 4 categories Education: 8 different categories Default if there was a default payment in the record Housing: house owner or renting (yeso) Loan: has an outstanding loan or not (yeso) Duration: call time in seconds Outcome: customer did open the new line of credit or not (yeso) Car Data: Car_value: estimated dollar value of customer car Mfg_year manufacturing year of car Mileage: reported car mileage Fuel_type: CNG/Petrol/Diesel Color Doors ABS: having ABS system (1/0 as yeso) Central lock: having the system(1/0 as yeso) Powered Window: having the system(1/0 as yeso) Categorical items include "unknown" status for those records the bank could not determine the job, marital status, etc. Build Pivot Tables for each of the following questions. Type the question number on top of each table (1-9): 1. Count of people at each education level who opened a new credit line and those who did not. 2. Average duration of promotion calls with people with different jobs by their loan status: have an outstanding loan, do not, or the status is unknown. 3. Average age by marital status of people who drive a car valued less than $20,000. Create a pivot chart for this table. 4. Average mileage of the cars based on their fuel type and having ABS system 5. Count of cars havingot having power windows. Use a slicer to show only green and grey cars. 6. Average age of people by their education level. Use a slicer to show only those with a university degree. 7. List of cars by their colors and number of doors, showing the count of cars having central lock in each group. 8. Average mileage of cars by fuel type and manufacturing year. Do not show the row and column of grand total. Use conditional formatting to highlight the largest and smallest average mileage of the table by two different background colors. 9. Average estimated price of cars by job and if the owner is also a house owner or rents the residence. Use conditional formatting to highlight the maximum average price. Data Review Insert Formulas View Tell me Draw Page Layout General Calib (Body) 11 - A A Del 33 Wrap Test Merge Center X Out 1 Cory & Format Consonal Format 6 % - 5 BTW A- 1 fx yes B 1 1 + G pied ch 4 will profesion on chool TE Na sert wi ODOSIE 10 FD - w 0001 w che buty Ver Neha ry divine 12 OBCE 2 ng 1 1 TET EN 410 13 PO wp 2122527 EURO ERRORE w 3 waployed Bay 12100 11000 Aaa Aaro PE 22:30 410 1 1 med 19 10 tech 18 ON ulert ce w IT OS cat wy et 18 23 33 24 13 W 1655 9614 12.10 Newheel 33 de Oscar 14 wap ih in NO erat SPSME ht 1 M o to come owing full Concerto four_dows 112 3 1 13750 2011 T2 D 1 43 115 2017 41711 D 1 65 2013 41000 Bil > 1 18 13710 l 1 163 12150 2011 61000 W 2 203 16100 2017 1 94412 3 Gwy + 1 ye 2017 1 son 1 11500 13700 Patrol 2013 1 Red 1 1 105 12350 2011 71138 be 1 2010 11401 2011 ww 1 184 1 1910 3 LEO 1 1 19:00 2011 129 Petrol 257 1 71000 Pro 1 71500 TO 14181 2017 GW 1 1 21 y 2017 107 1 34000 Peel 1 1 16 19 2017 7176 1 1 1 1 714 HO 2017 Grey 2141 Pet 201 16 2017 A Petrol Or 30 376 2011 6140 1 1 16110 2012 410 125 2011 2301 191 2011 . 17 JOL! 210 Pro Grey 104 2011 30 114 > 155 15 2017 BE 25 10 3019 Grey 10 w 3011 48 13 2017 124 15750 2017 19 41 2017 79510 161 2017 2017 GR 13 935 1575 2012 1000 Petrol Grey 1 2011 Pro Grey 140 2017 100 per 1 101 1 157 1011 115 ve 1 25329 Peral 1 14756 31500 Ft 1 100 2017 4101 Petr 1 15 yes 1 16750 1 2011 10 4661 Pare 1 1 12 TES 2012 110404 Red 1 1 65 2013 SOLO 1 1 154 16000 1000 ir D 1 Blue 12315 DE Gry 417 Gwy 1 ro 2011 2 5. JOIT 2018 om 1 15 20500 NIT SP 1 1 HO 310 1 1 1 11100 2011 F D 10 m 1 52 1 1214 1535 Parol 1 re a tudom 47 FE 41415 44141 11070 9 1 10 11 11 PE 45 win it 21 wie 15 M OSSE OSPE DOST E ver Per 41000 5 wa Nahol by NES mu ma PE yes pan 01851 1000 200 wheel 1 ht Yes 1 1 1 w LIGE INES P ba ME SONT 0 * 410 Scala 53 5 OSE re 11 1001 prof 2011 OSE tubes tener serebro 1 1 4 WAR 24 w 2011 Sey ng 112 BE on 0641 OSALE 101 Si 05021 1 FE WE 1570 M WS ITE E VE 27 FE ye 13 36 17 NE TOP 4 13

Step by Step Solution

There are 3 Steps involved in it

1 Expert Approved Answer
Step: 1 Unlock blur-text-image
Question Has Been Solved by an Expert!

Get step-by-step solutions from verified subject matter experts

Step: 2 Unlock
Step: 3 Unlock

Students Have Also Explored These Related General Management Questions!