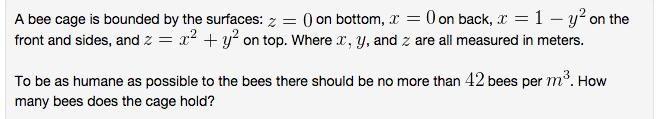
A bee cage is bounded by the surfaces: z = 0 on bottom, x = 0...
Fantastic news! We've Found the answer you've been seeking!
Question:
Transcribed Image Text:
A bee cage is bounded by the surfaces: z = 0 on bottom, x = 0 on back, x = 1 - y? on the front and sides, and z = x2 + y on top. Where x, y, and z are all measured in meters. To be as humane as possible to the bees there should be no more than 42 bees per m. How many bees does the cage hold? A bee cage is bounded by the surfaces: z = 0 on bottom, x = 0 on back, x = 1 - y? on the front and sides, and z = x2 + y on top. Where x, y, and z are all measured in meters. To be as humane as possible to the bees there should be no more than 42 bees per m. How many bees does the cage hold?
Expert Answer:
Related Book For
Calculus Early Transcendentals
ISBN: 978-0321947345
2nd edition
Authors: William L. Briggs, Lyle Cochran, Bernard Gillett
Posted Date:
Students also viewed these accounting questions
-
Sketch the region bounded by the surfaces z = x 2 + y 2 and x 2 + y 2 = 1 for 1 < z < 2.
-
The solid E shown below is bounded by the parabolic cylinder x = y2 and the planes z = 0, z = x, and x = 1. Fill in the blanks and then find the volume of E. V(E)= 1 dzdxdy 1 0 ZA z= X E y 1 X
-
The region R 1 is bounded by the graph of y = tan x and the x-axis on the interval [0, /3]. The region R 2 is bounded by the graph of y = sec x and the x-axis on the interval [0, /6]. Which region...
-
By knowing the value of e/m how you will calculate the mass of an electron?
-
Why is it the chance of loss, and not the loss itself, that creates the need for insurance?
-
Sketch portions of a linear polystyrene molecule that are (a) Syndiotactic, (b) Atactic, and (c) Isotactic. Use two-dimensional schematics per footnote 8 of this chapter.
-
Is each UC restricted to one Actor?
-
The following accounts and related balances of Hunt Designers, Inc., as of December 31, 2014, are arranged in no particular order: Requirements 1. Prepare Hunts classified balance sheet in the...
-
3) Consider a system with 4 resources (A, B, C, D) in quantity (5, 3, 3, 3). The Banker's Algorithm is used to allocate resources and it has the following SAFE state: Available: A B C D 1 2 0 1...
-
Mitchell Mineral Water, Inc., will pay a quarterly dividend per share of $.95 at the end of each of the next 12 quarters. Thereafter, the dividend will grow at a quarterly rate of 1 percent, forever....
-
Suppose that five balls are sampled with replacement from an urn that contains 10 red balls, 10 blue balls, 5 green balls and 5 yellow balls and let R, B, G and Y, respectively, denote the numbers of...
-
1. Consider steady, incompressible viscous flow in an annulus, the region between concentric circular cylinders, where the velocity is only in the z-direction out of the page. Find the velocity...
-
a) 1) - the graph showing the annual financial performance of a business company known as SIME DARBY BERHAD. By using the following Profit Margin data (% - blue line) in Figure 2, Construct the...
-
A process to fill boxes of sugar is targeting an average of 2.00 pounds of sugar per bag plus and minus 0.03. What is the Defect Per Million Opportunity if the process puts 2.01 pounds in every bag...
-
2. (10 points) According to the life-cycle hypothesis individuals care about the PDV of their lifetime income in making current consumption decisions. As a result in our short run model, we have...
-
1) (Bertrand Model with sequential move) Consider a Bertrand duopoly model with two firms, F and F selling two varieties of a product. The demand curve for Fi's product is 91 (P1-P2) = 10-P1 +0.5p2,...
-
DonutsDunRite has the following overhead during the month: Equipment setup: 20 hours costing $2,100 Machine hours: 3,000 hours costing $65,000 Moving product: 60 hours costing $1,200 The company...
-
What is an insurable interest? Why is it important?
-
Find the area of the surface generated when the given curve is revolved about the x-axis. y = x 3 on [0, 1]
-
Let R be the region bounded by the following curves. Use the disk method to find the volume of the solid generated when R is revolved about the x-axis. y = 25 - x 2 , y = 0 (Verify that your answer...
-
Sketch the graph of a smooth function f and label a point P(a, (f(a)) on the curve. Draw the line that represents the linear approximation to f at P.
-
When we are given the value of the _____________________ variable, we can use the least-squares regression line to predict the value of the ______________________ variable. In Exercises 57, fill in...
-
The least-squares regression line predicts the result of changing the value of the explanatory variable. In Exercises 812, determine whether the statement is true or false. If the statement is false,...
-
For each of the following plots, interpret the y-intercept of the least-squares regression line if possible. If not possible, explain why not. a. The least-squares regression line is = 1.98 +...
Study smarter with the SolutionInn App