

For each of the following plots, interpret the y-intercept of the least-squares regression line if possible. If
Question:
For each of the following plots, interpret the y-intercept of the least-squares regression line if possible. If not possible, explain why not.
a. The least-squares regression line is ŷ = 1.98 + 0.039x, where x is the temperature in a freezer in degrees Fahrenheit, and y is the time it takes to freeze a certain amount of water into ice.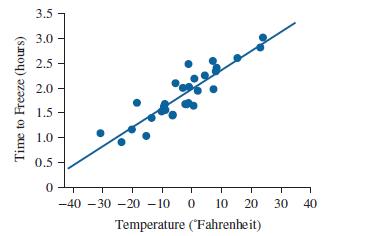
b. The least-squares regression line is ŷ = −13.586 + 4.340x, where x represents the age of an elementary school student and y represents the score on a standardized test.
Fantastic news! We've Found the answer you've been seeking!
Step by Step Answer:

Answered By
Antony Mutonga
I am a professional educator and writer with exceptional skills in assisting bloggers and other specializations that necessitate a fantastic writer. One of the most significant parts of being the best is that I have provided excellent service to a large number of clients. With my exceptional abilities, I have amassed a large number of references, allowing me to continue working as a respected and admired writer. As a skilled content writer, I am also a reputable IT writer with the necessary talents to turn papers into exceptional results.
2+ Reviews
10+ Question Solved
Related Book For 

Question Posted:
