

Question: ( a ) Best - fit functions you found ( fit both linear and quadratic model ) , and the associated squared errors. ( b
a Bestfit functions you found fit both linear and quadratic model and the associated squared
errors.
b Plot of original data, and then on the same graph, plot the fitted data from bestfit models use
different colors and plot types, eg plotfitr would plot the fit data as red asterisks;
plotfitg would plot green plus signs. Give a key for the plots
c Conclusions what was the best model and why? Are there any properties of the materials involved
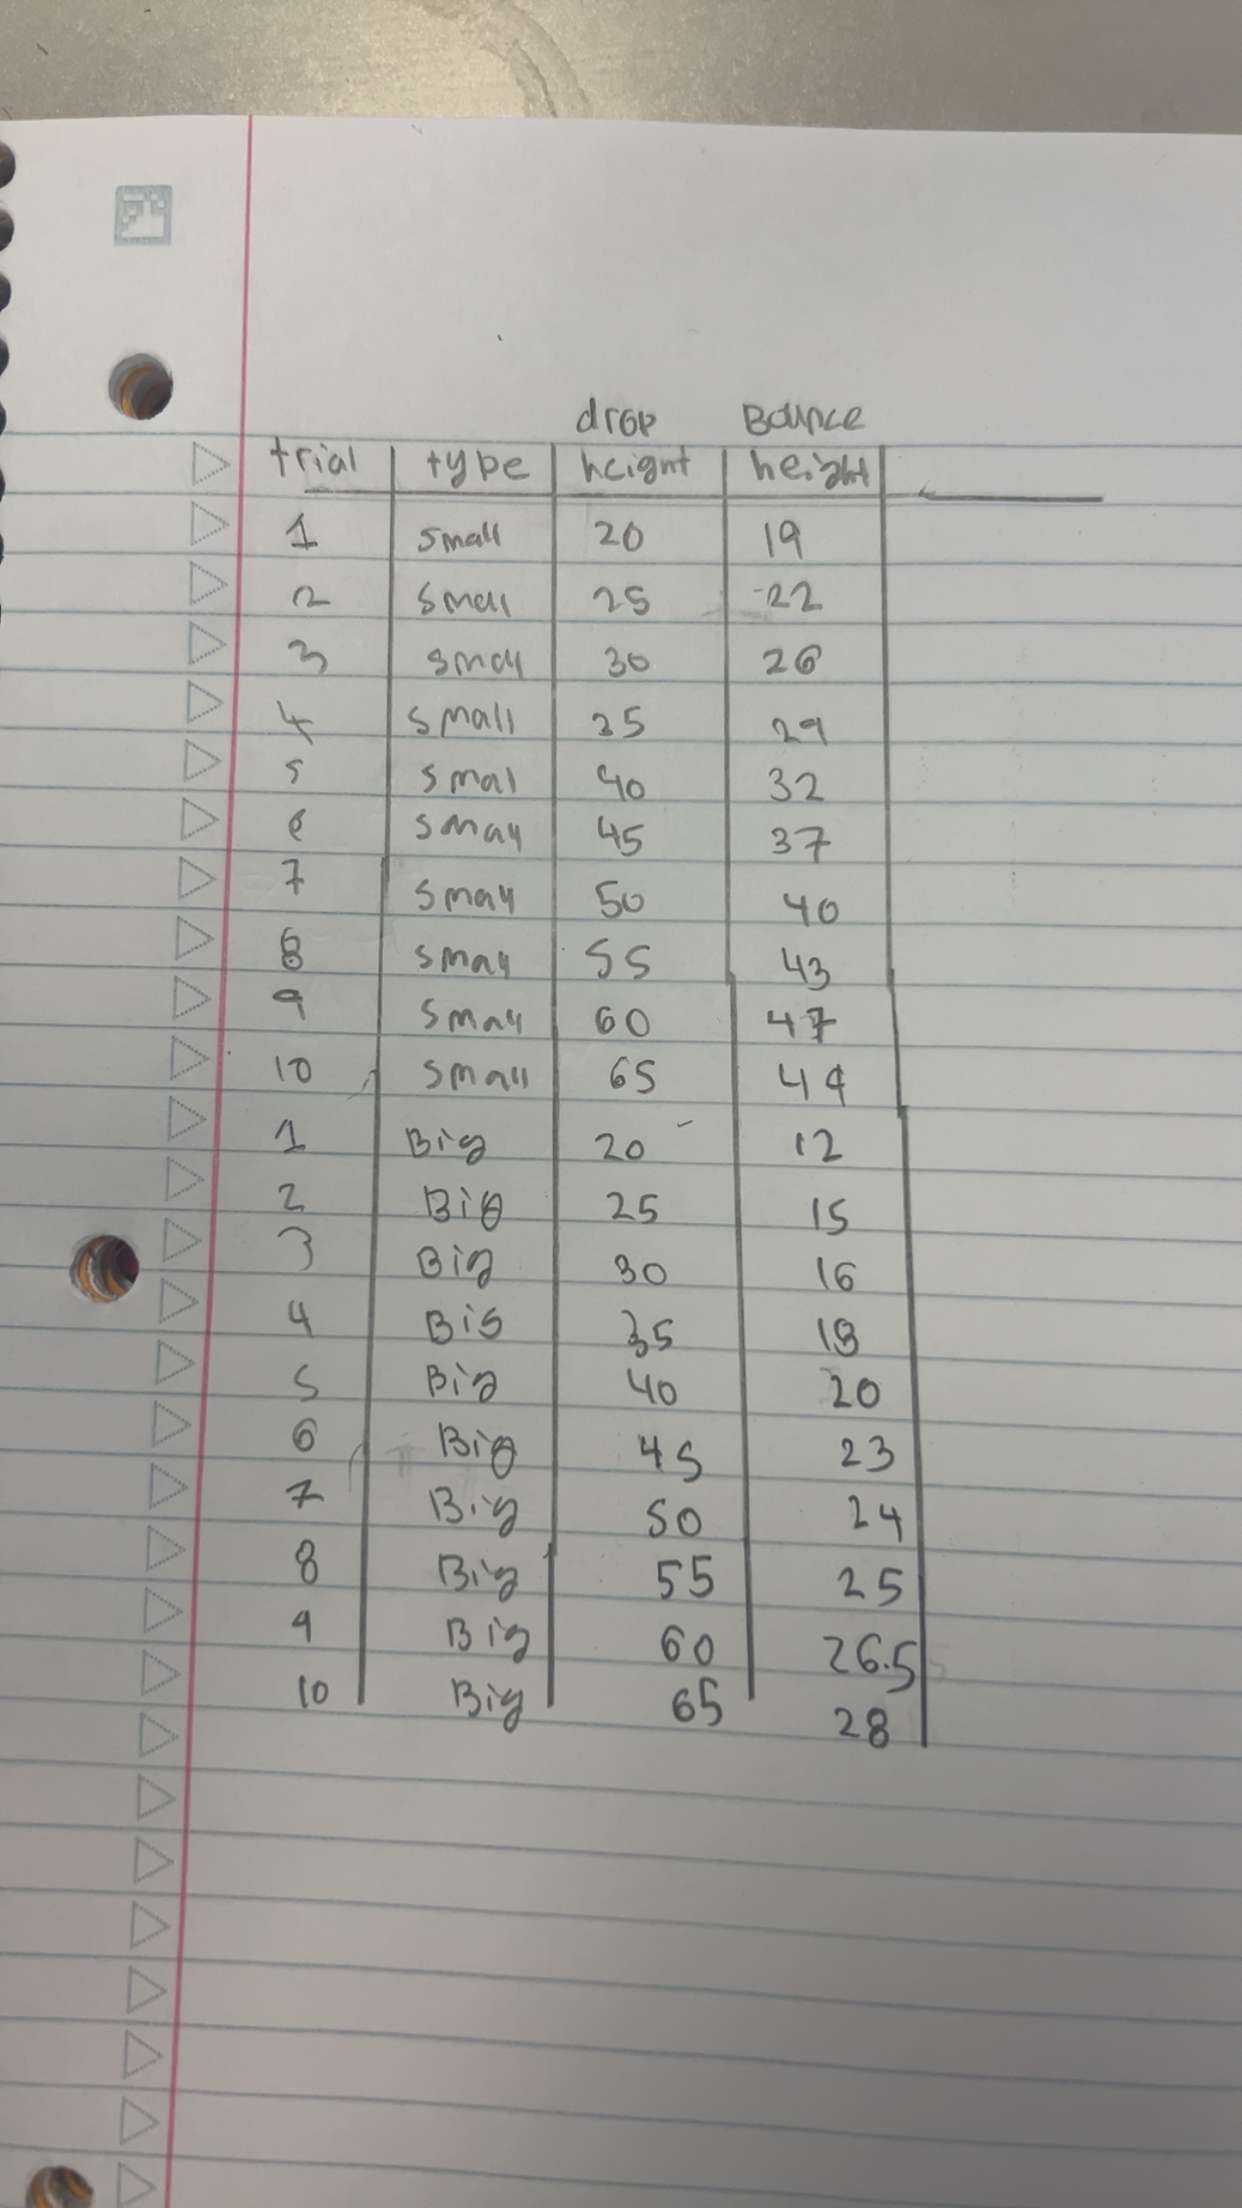
that could have caused the results you observed? Can you complete all parts using the following table.
Step by Step Solution
There are 3 Steps involved in it
1 Expert Approved Answer
Step: 1 Unlock

Question Has Been Solved by an Expert!
Get step-by-step solutions from verified subject matter experts
Step: 2 Unlock
Step: 3 Unlock