

Question: A boxplot for a set of data is shown below. 500 520 540 560 580 600(c) Give a rough approximation for the mean of the
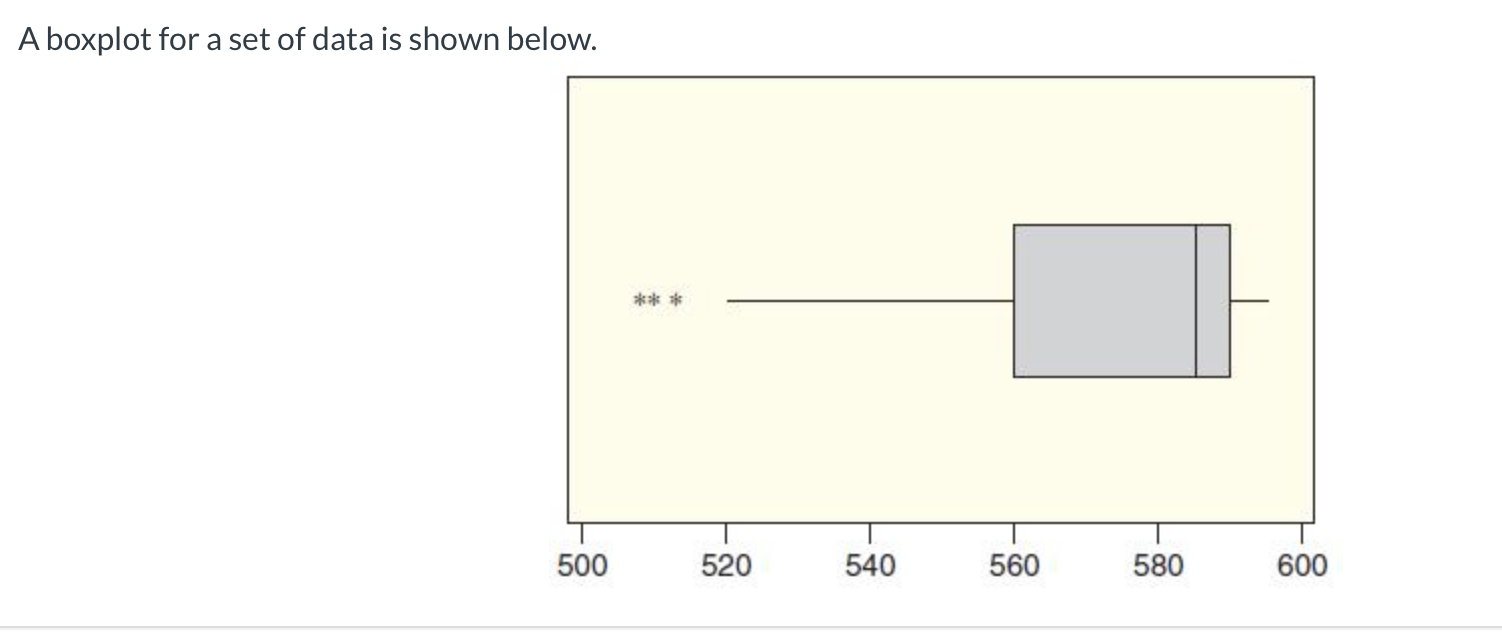
A boxplot for a set of data is shown below. 500 520 540 560 580 600(c) Give a rough approximation for the mean of the dataset. Round your answer to the nearest integer
Step by Step Solution
There are 3 Steps involved in it
1 Expert Approved Answer
Step: 1 Unlock

Question Has Been Solved by an Expert!
Get step-by-step solutions from verified subject matter experts
Step: 2 Unlock
Step: 3 Unlock