

Question: Show a boxplot for a set of data. In each case: (a) Indicate whether the distribution of the data appears to be skewed to the
Show a boxplot for a set of data. In each case:
(a) Indicate whether the distribution of the data appears to be skewed to the left, skewed to the right, approximately symmetric, or none of these.
(b) Are there any outliers? If so, how many and are they high outliers or low outliers?
(c) Give a rough approximation for the mean of the dataset.
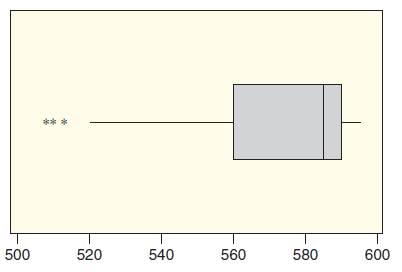
*** 500 520 540 560 580 600
Step by Step Solution
★★★★★
3.41 Rating (154 Votes )
There are 3 Steps involved in it
1 Expert Approved Answer
Step: 1 Unlock

a Half of the data lies between 585 and 595 while the other half the lef... View full answer
Question Has Been Solved by an Expert!
Get step-by-step solutions from verified subject matter experts
Step: 2 Unlock
Step: 3 Unlock