

Question: A bungee jumper drops from rest off a bridge, and is in freefall for half of the distance to the ground. Her cable then kicks
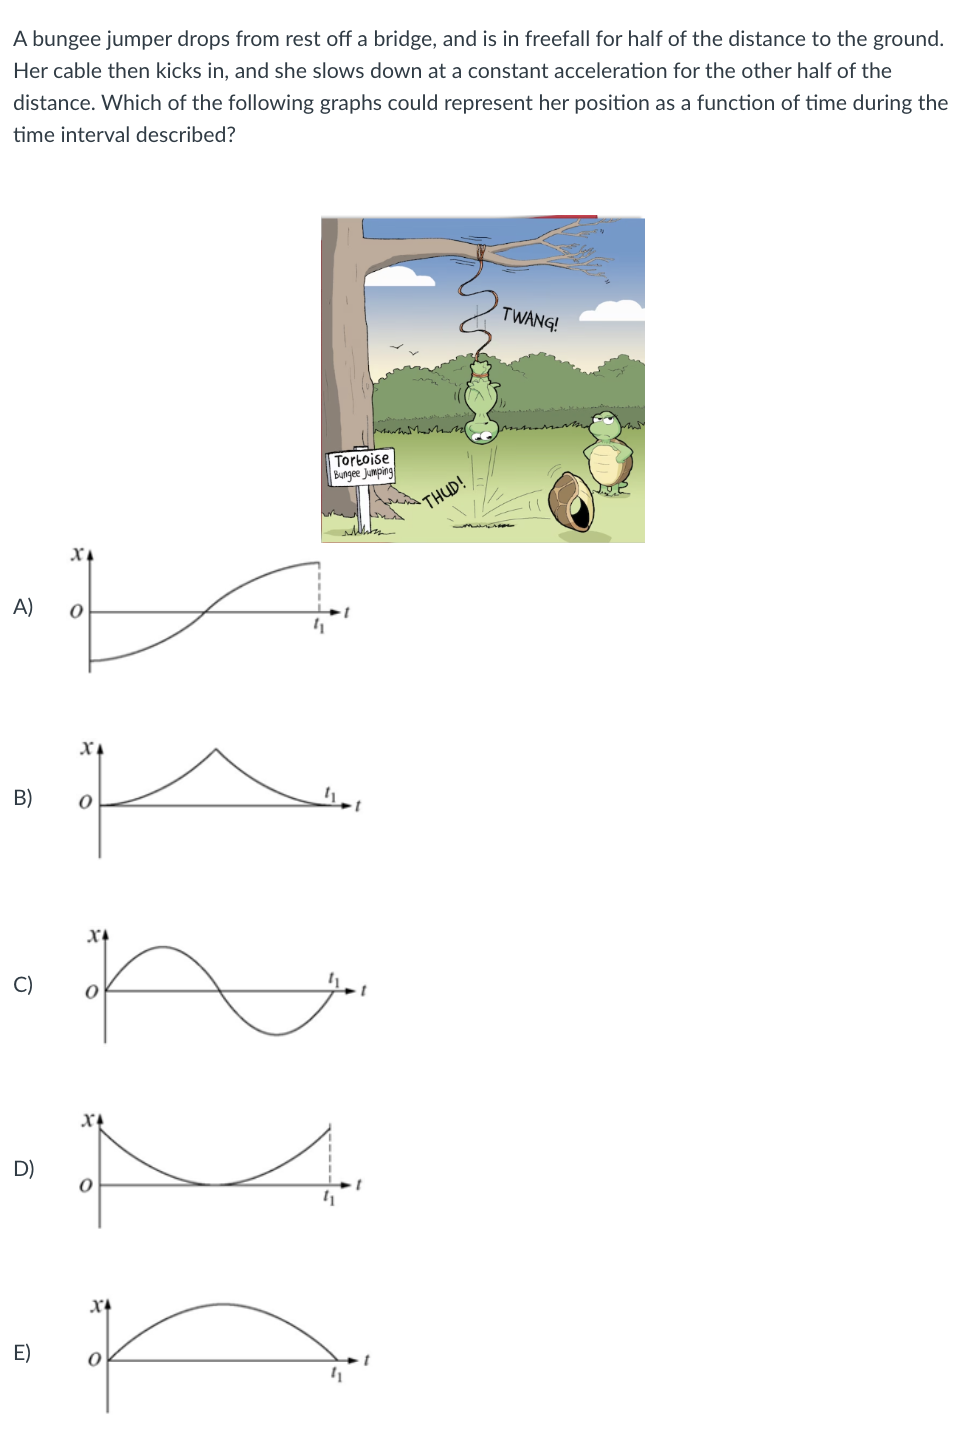

A bungee jumper drops from rest off a bridge, and is in freefall for half of the distance to the ground. Her cable then kicks in, and she slows down at a constant acceleration for the other half of the distance. Which of the following graphs could represent her position as a function of time during the time interval described? C)
Step by Step Solution
There are 3 Steps involved in it
1 Expert Approved Answer
Step: 1 Unlock

Question Has Been Solved by an Expert!
Get step-by-step solutions from verified subject matter experts
Step: 2 Unlock
Step: 3 Unlock