Question: a. C. B. a. C. C. a. 1. Speakers and Company - Forecasting Demand (20 total points) Mark Pricel the new productions manager for Speakers
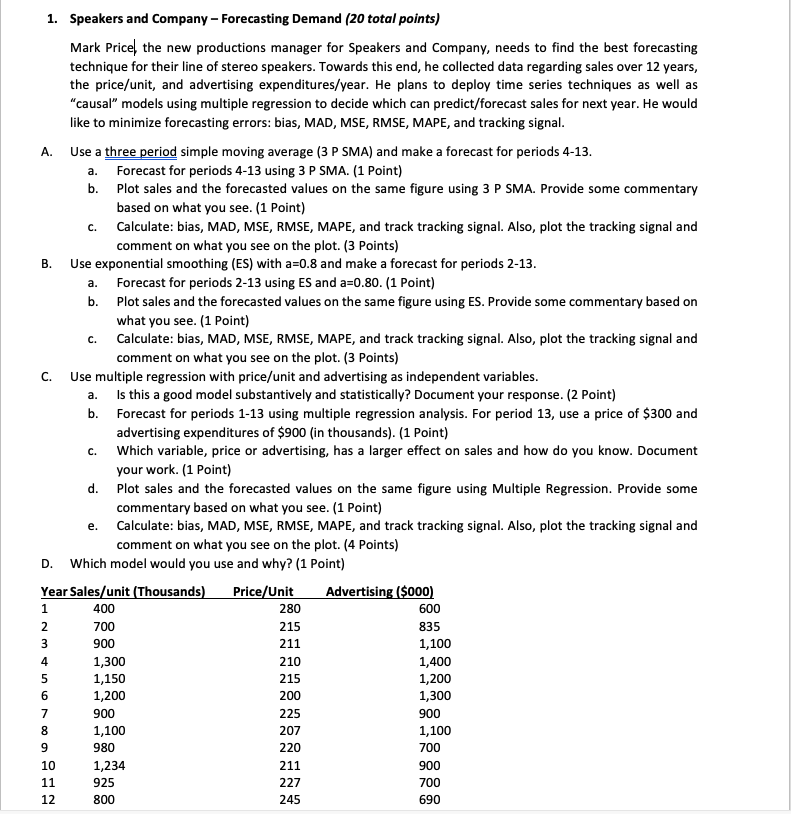
a. C. B. a. C. C. a. 1. Speakers and Company - Forecasting Demand (20 total points) Mark Pricel the new productions manager for Speakers and Company, needs to find the best forecasting technique for their line of stereo speakers. Towards this end, he collected data regarding sales over 12 years, the price/unit, and advertising expenditures/year. He plans to deploy time series techniques as well as "causal" models using multiple regression to decide which can predict/forecast sales for next year. He would like to minimize forecasting errors: bias, MAD, MSE, RMSE, MAPE, and tracking signal. A. Use a three period simple moving average (3 P SMA) and make a forecast for periods 4-13. Forecast for periods 4-13 using 3 P SMA. (1 Point) b. Plot sales and the forecasted values on the same figure using 3 P SMA. Provide some commentary based on what you see. (1 Point) Calculate: bias, MAD, MSE, RMSE, MAPE, and track tracking signal. Also, plot the tracking signal and comment on what you see on the plot. (3 Points) Use exponential smoothing (ES) with a=0.8 and make a forecast for periods 2-13. Forecast for periods 2-13 using ES and a=0.80. (1 Point) b. Plot sales and the forecasted values on the same figure using Es. Provide some commentary based on what you see. (1 Point) Calculate: bias, MAD, MSE, RMSE, MAPE, and track tracking signal. Also, plot the tracking signal and comment on what you see on the plot. (3 Points) Use multiple regression with price/unit and advertising as independent variables. Is this a good model substantively and statistically? Document your response. (2 Point) b. Forecast for periods 1-13 using multiple regression analysis. For period 13, use a price of $300 and advertising expenditures of $900 (in thousands). (1 Point) Which variable, price or advertising, has a larger effect on sales and how do you know. Document your work. (1 Point) d. Plot sales and the forecasted values on the same figure using Multiple Regression. Provide some commentary based on what you see. (1 Point) Calculate: bias, MAD, MSE, RMSE, MAPE, and track tracking signal. Also, plot the tracking signal and comment on what you see on the plot. (4 points) Which model would you use and why? (1 Point) Year Sales/unit (Thousands) Price/Unit Advertising ($000) 400 280 600 215 835 3 1,100 1,300 210 1,400 1,150 215 1,200 1,200 200 1,300 225 8 1,100 207 1,100 9 980 700 1,234 900 925 700 690 C. e. D. 1 2 700 900 211 4 5 6 7 900 900 10 11 12 220 211 227 245 800


