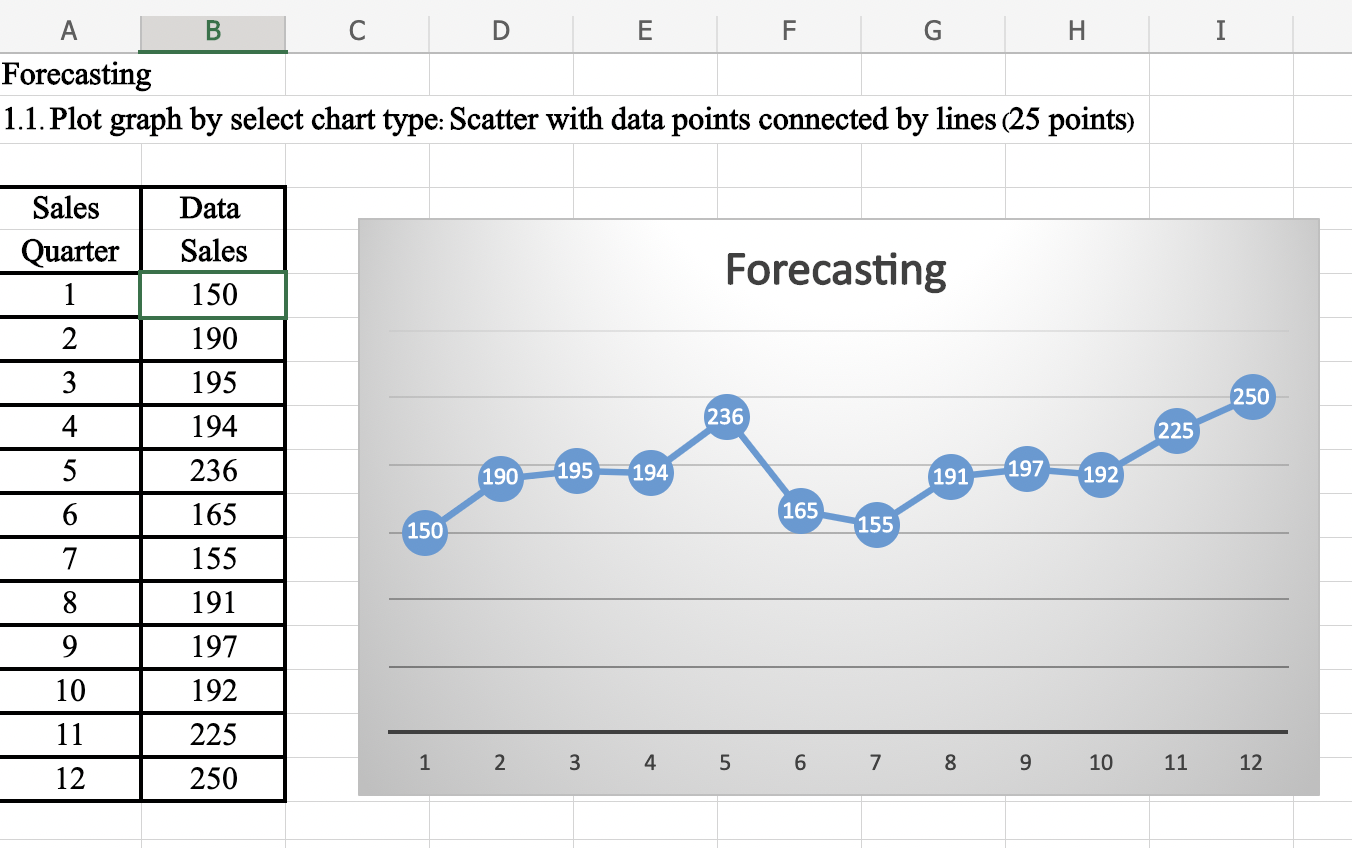
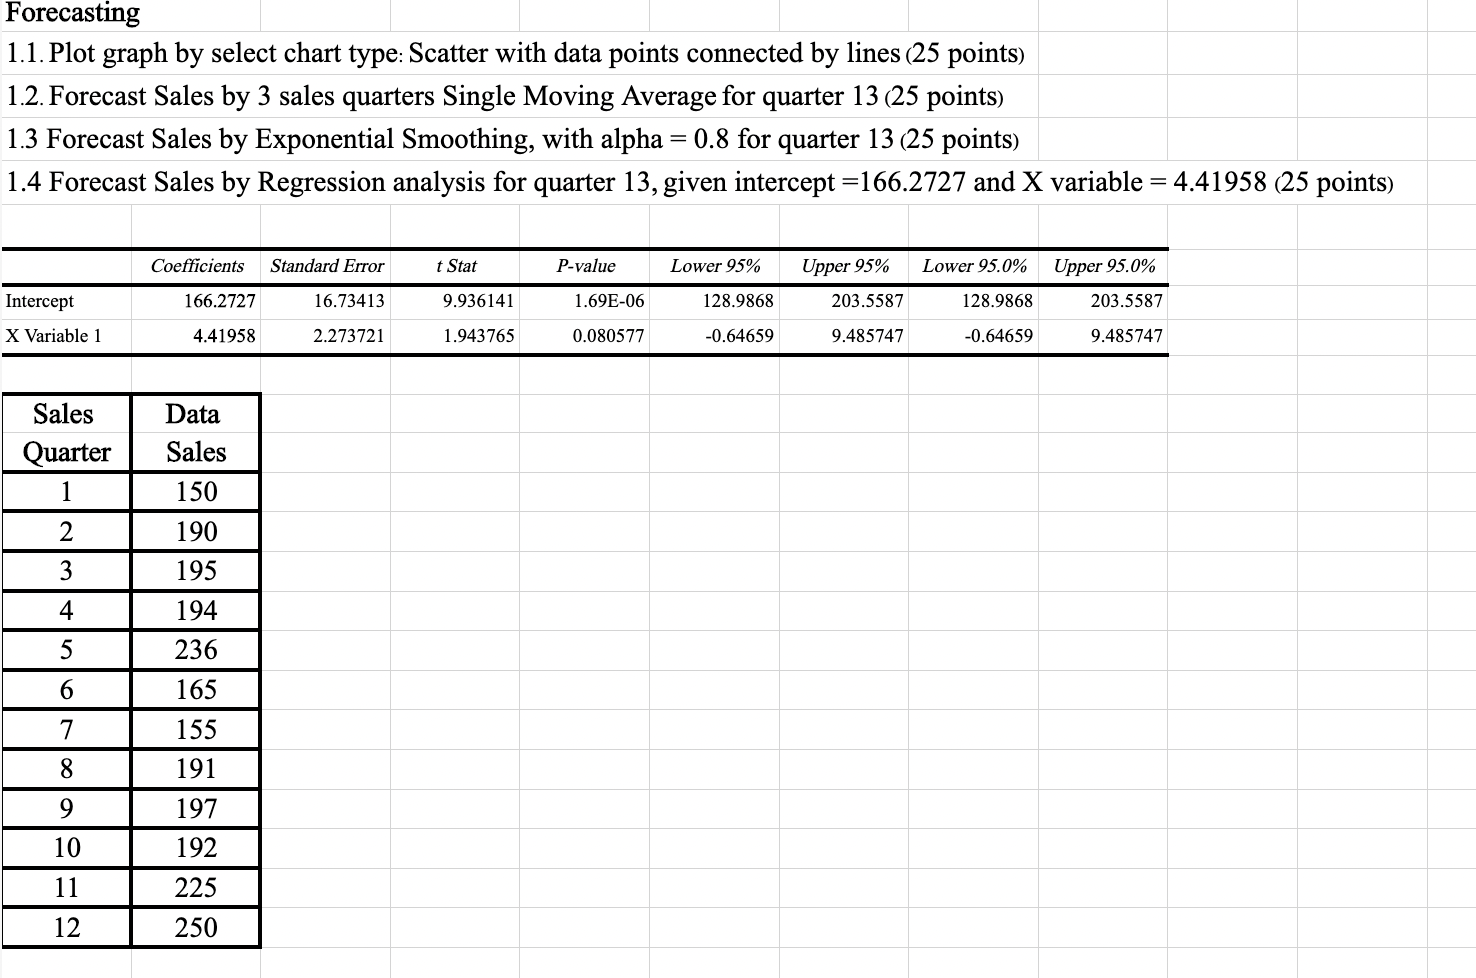
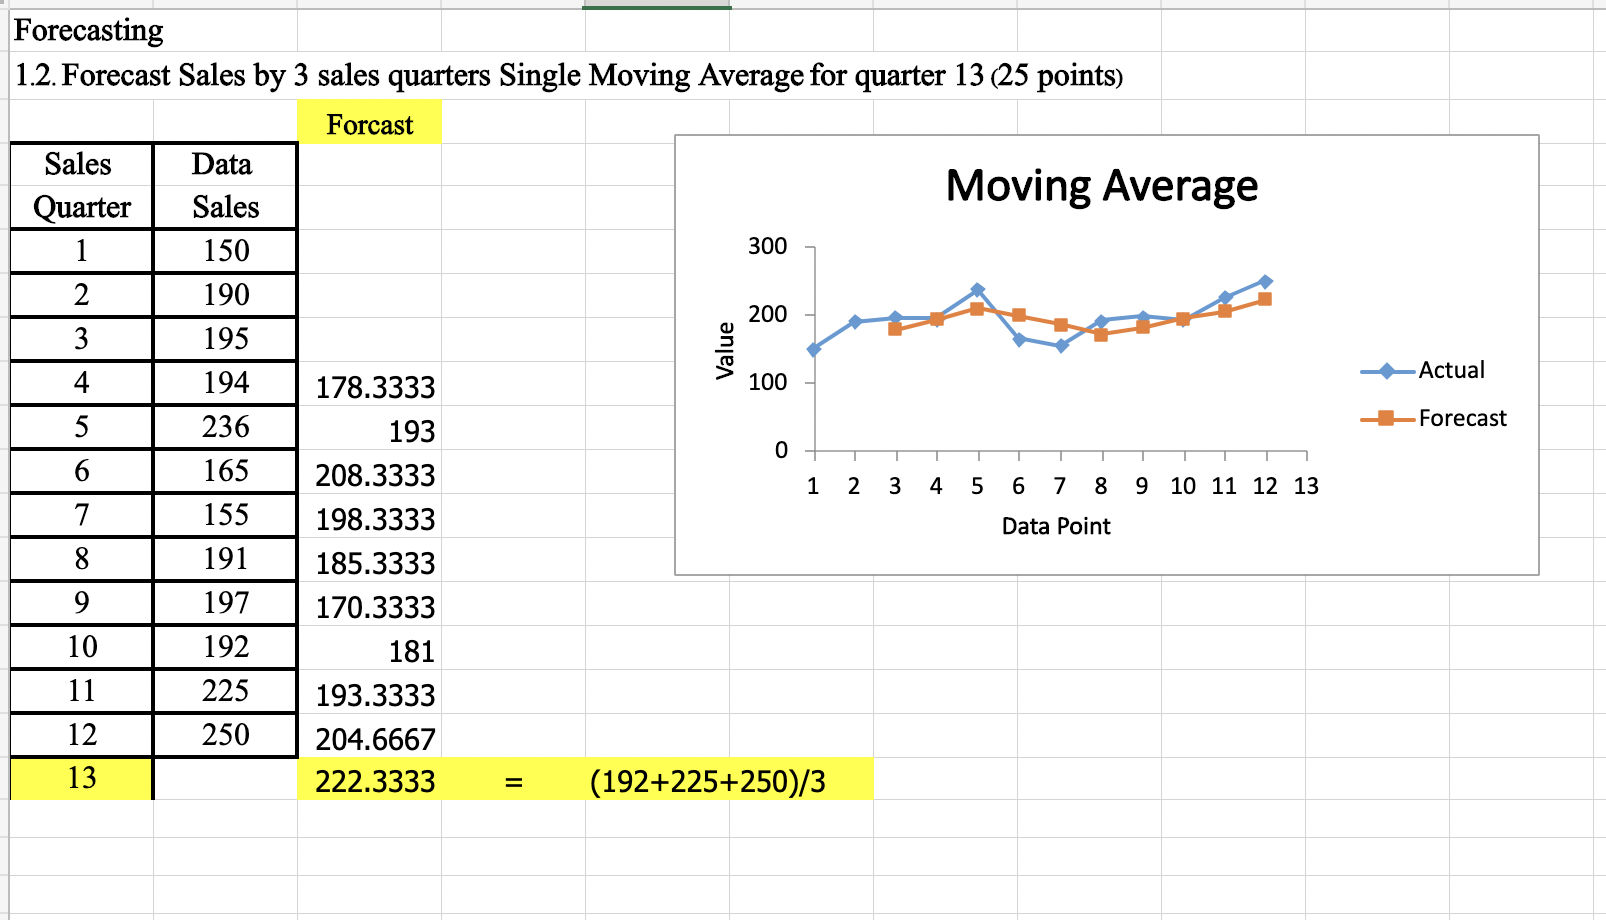
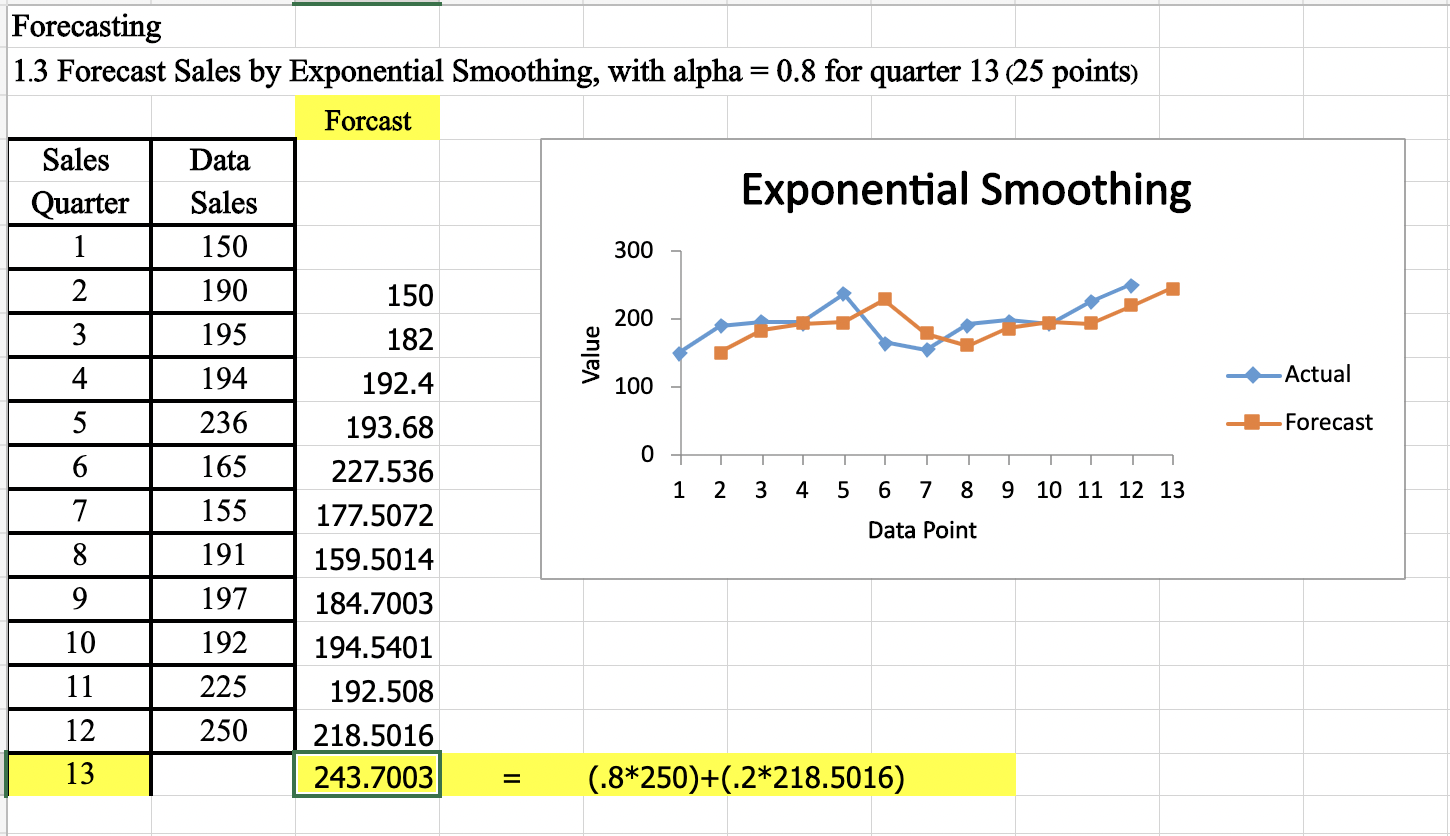
Question: A C D E F G H I Forecasting 1.1. Plot graph by select chart type: Scatter with data points connected by lines (25 pointS)

A C D E F G H I Forecasting 1.1. Plot graph byA C D E F G H I Forecasting 1.1. Plot graph byA C D E F G H I Forecasting 1.1. Plot graph byA C D E F G H I Forecasting 1.1. Plot graph byA C D E F G H I Forecasting 1.1. Plot graph by
A C D E F G H I Forecasting 1.1. Plot graph by select chart type: Scatter with data points connected by lines (25 pointS) Forecasting 1.1. Plot graph by select chart type: Scatter with data points connected by lines (25 points) 1.2. Forecast Sales by 3 sales quarters Single Moving Average for quarter 13 (25 pointS) 1.3 Forecast Sales by Exponential Smoothing, with alpha = 0.8 for quarter 13 (25 pointS) 1.4 Forecast Sales by Regression analysis for quarter 13, given intercept =166.2727 and X variable = 4.41958 (25 points) Coe'icionts Standard Error r Stat Pvalue Lower 95% Upper 95% Lower 95. 0% Upper 95. 0% Intercept 166.2727 16.73413 9.936141 1.69E06 128.9868 203.5587 128.9868 203.5587 X Variable 1 4.41958 2.273 72] 1.943765 0.080577 -0.64659 9.485747 43.64659 9.485747 Forecasting 1.2. Forecast Sales by 3 sales quarters Single Moving Average for quarter 13 (25 points) Forcast Sales Data Quarter Sales Moving Average 1 150 300 2 190 200 W 195 Value A 194 -Actual 178.3333 100 U 236 193 - Forecast 0 6 165 208.3333 1 2 3 4 5 6 7 8 9 10 11 12 13 7 155 198.3333 Data Point OO 191 185.3333 197 170.3333 10 192 181 11 225 193.3333 12 250 204.6667 13 222.3333 (192+225+250)/3Forecasting 1.3 Forecast Sales by Exponential Smoothing, with alpha = 0.8 for quarter 13 (25 points) Forcast Sales Data Quarter Sales Exponential Smoothing 1 150 300 2 190 150 195 200 3 182 Value 4 194 192.4 100 Actual U 236 193.68 - Forecast 6 165 0 227.536 7 155 1 2 3 4 5 6 7 8 9 10 11 12 13 177.5072 Data Point 8 191 159.5014 9 197 184.7003 10 192 194.5401 11 225 192.508 12 250 218.5016 13 243.7003 (.8*250)+(.2*218.5016)Forecasting 1.4 Forecast Sales by Regression analysis for quarter 13, given intercept =166.2727 and X variable = 4.41958 (25 points) C ne'icients Standard Bum t S tat P value Lower 95% Upper 95% Lower 95.0% Upper 95.0% Intercept 166.2727 16.73413 9.936141 1.69E06 128.9868 203.5587 128.9868 203.5587 X Variable 1 4.41958 2.273721 1.943765 0.080577 -0.64659 9.485747 -0.64659 9.485747 Forcast Y=aX+b Sales Data Quarter Sales 1 50 190 195 194 236 165 155 191 197 192 225 250 pl pl . N pI W (4.41958*13)+166.2727

Step by Step Solution

There are 3 Steps involved in it

1 Expert Approved Answer
Step: 1 Unlock blur-text-image
Question Has Been Solved by an Expert!

Get step-by-step solutions from verified subject matter experts

Step: 2 Unlock
Step: 3 Unlock

Students Have Also Explored These Related General Management Questions!