

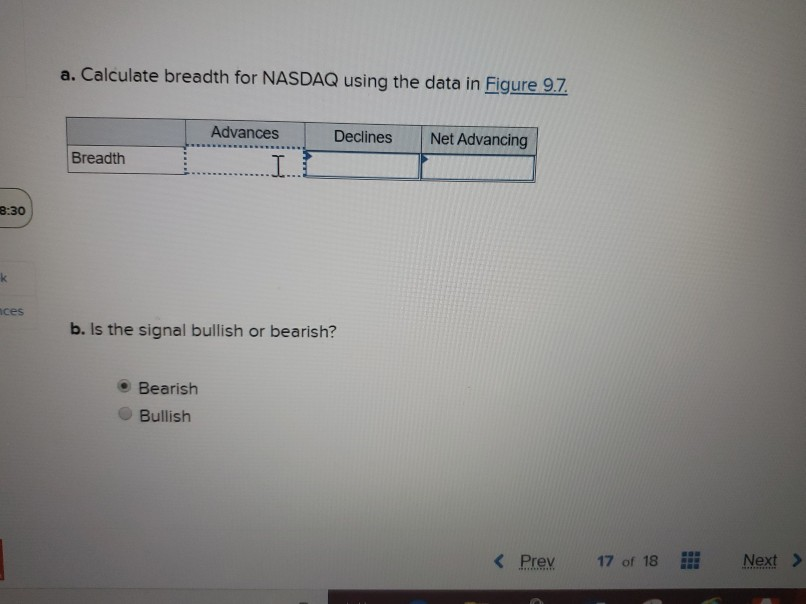
Question: a. Calculate breadth for NASDAQ using the data in Figure 9.7. Declines Net Advancing Advances I. Breadth 3:30 ces b. Is the signal bullish or
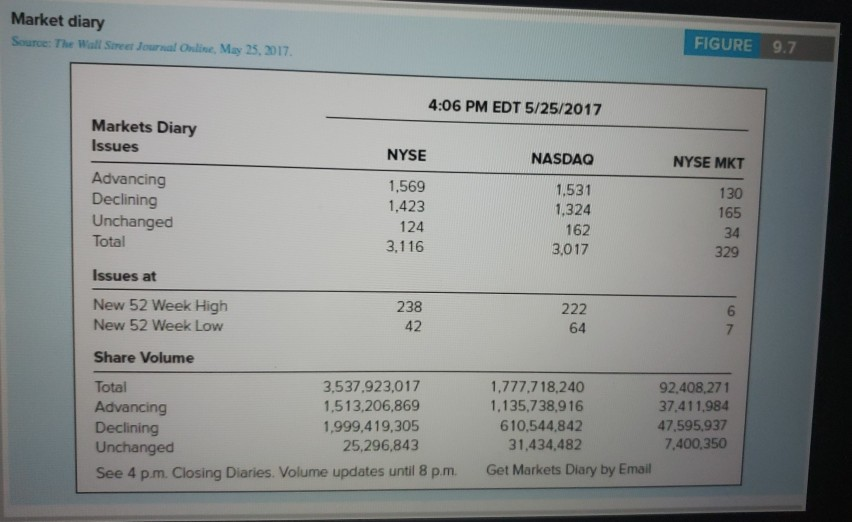
a. Calculate breadth for NASDAQ using the data in Figure 9.7. Declines Net Advancing Advances I. Breadth 3:30 ces b. Is the signal bullish or bearish? Bearish Bullish Market diary Source: The Wall Street Journal Online, May 25, 2017 FIGURE 9.7 4:06 PM EDT 5/25/2017 Markets Diary Issues NYSE Advancing Declining Unchanged Total 1.569 1,423 124 3,116 NASDAQ 1.531 1.324 162 3,017 NYSE MKT 130 165 329 Issues at New 52 Week High New 52 Week Low 238 222 42 64 Share Volume Total 3,537.923,017 Advancing 1,513,206,869 Declining 1.999,419,305 Unchanged 25,296,843 See 4 p.m. Closing Diaries. Volume updates until 8 p.m. 1,777,718,240 92,408,271 1,135,738,916 37,411,984 610.544,842 47.595,937 31,434,482 7,400,350 Get Markets Diary by Email
Step by Step Solution
There are 3 Steps involved in it

Get step-by-step solutions from verified subject matter experts