

Question: A) Calculate the mean and range for the above samples B) Determine X bar and R bar C) Determine the UCL and LCL for a
 A) Calculate the mean and range for the above samples
B) Determine X bar and R bar
C) Determine the UCL and LCL for a X bar chart.
D) Determine the UCL and LCL for R-chart
E) What comments can you make about the process?
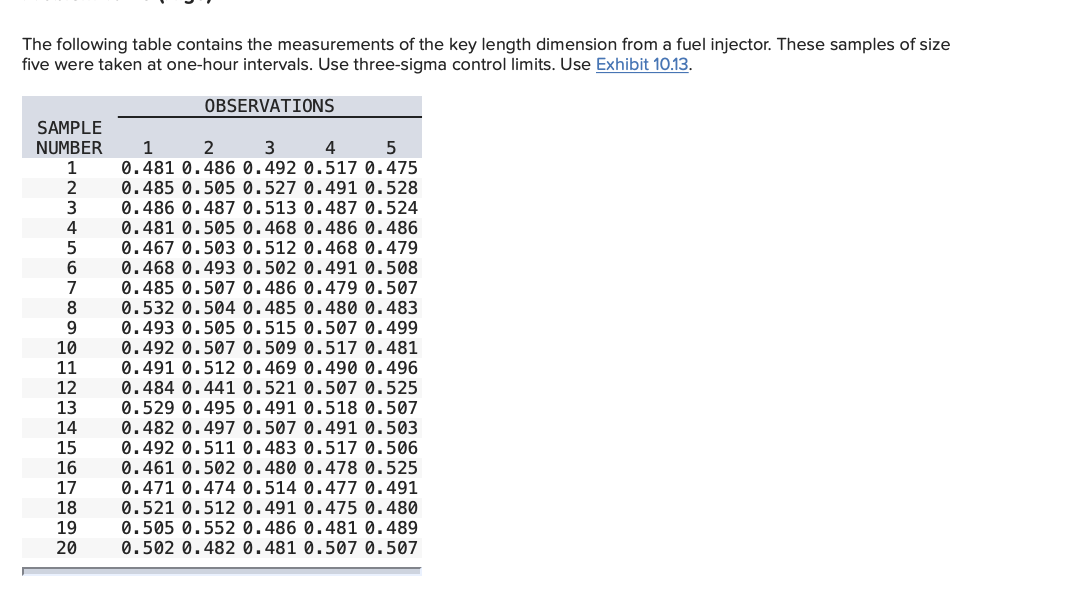
The following table contains the measurements of the key length dimension from a fuel injector. These samples of size five were taken at one-hour intervals. Use three-sigma control limits. Use Exhibit 10.13. OBSERVATIONS SAMPLE NUMBER 1 2 3 4 5 6 7 8 9 10 11 12 13 14 15 16 17 18 19 20 1 2 3 4 5 0.481 0.486 0.492 0.517 0.475 0.485 0.505 0.527 0.491 0.528 0.486 0.487 0.513 0.487 0.524 0.481 0.505 0.468 0.486 0.486 0.467 0.503 0.512 0.468 0.479 0.468 0.493 0.502 0.491 0.508 0.485 0.507 0.486 0.479 0.507 0.532 0.504 0.485 0.480 0.483 0.493 0.505 0.515 0.507 0.499 0.492 0.507 0.509 0.517 0.481 0.491 0.512 0.469 0.490 0.496 0.484 0.441 0.521 0.507 0.525 0.529 0.495 0.491 0.518 0.507 0.482 0.497 0.507 0.491 0.503 0.492 0.511 0.483 0.517 0.506 0.461 0.502 0.480 0.478 0.525 0.471 0.474 0.514 0.477 0.491 0.521 0.512 0.491 0.475 0.480 0.505 0.552 0.486 0.481 0.489 0.502 0.482 0.481 0.507 0.507
Step by Step Solution
There are 3 Steps involved in it
1 Expert Approved Answer
Step: 1 Unlock

Question Has Been Solved by an Expert!
Get step-by-step solutions from verified subject matter experts
Step: 2 Unlock
Step: 3 Unlock