

Question: a) Calculate the mean and standard deviation. b) Generate a histogram from the data and normalize the histogram to represent the probability density function (PDF).
a) Calculate the mean and standard deviation.
b) Generate a histogram from the data and normalize the histogram to represent the probability density function (PDF). c) Calculate the PDF for the bin locations in part b using the equation for a normal distribution and the parameters calculated in part a.
d) Plot the PDF from part b as a bar graph and the PDF in part c as a line graph on the same chart. Do they overlap correctly? If not, explain why.
--> Above are the questions I need to answer and below is my code. I am not sure how to upload the excel file I used but its pretty much random data. When the graph is generated the line does not go over the bars and I am not sure how to fix it. I think that I did not do part C right and I need the bin in order for the line to fit. please show me in code form how I can incorporate C into my code.
Using MATLAB
numData= 2*xlsread('hw2.xlsx')+5; t=numData(:,1); bin=numData(:,2); m=mean(numData,1); s=std(t);
histogram(t,'Normalization','pdf') hold on y=-5:0.1:20; mu=5; sigma=2; f = exp(-(y-mu).^2./(2*sigma^2))./(sigma*sqrt(2*pi)); plot(y,f,'LineWidth',1.5)
fprintf('Standard Deviation:%.3f ',s) fprintf('Mean:%.3f ',m)
Here is what the graph looks like and I need the line to move over to the right.
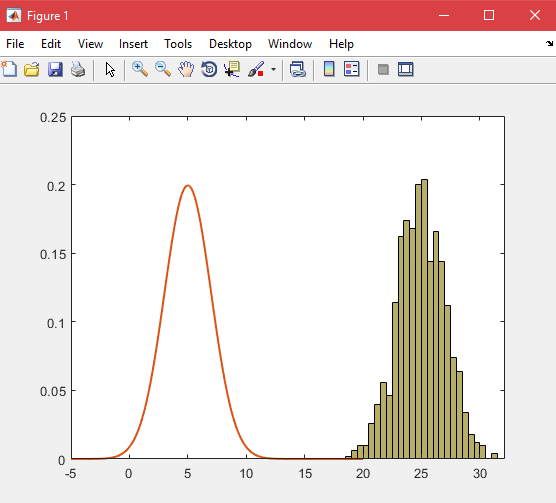
qure File Edit View Insert Tools Desktop Window Help 0.25 0.2 0.15 0.1 0.05 10 15 20 25 30 -5 qure File Edit View Insert Tools Desktop Window Help 0.25 0.2 0.15 0.1 0.05 10 15 20 25 30 -5
Step by Step Solution
There are 3 Steps involved in it

Get step-by-step solutions from verified subject matter experts