

Question: a) Calculate the trial control limits for X & R or X & S control charts. b) Are the control limits you calculated in
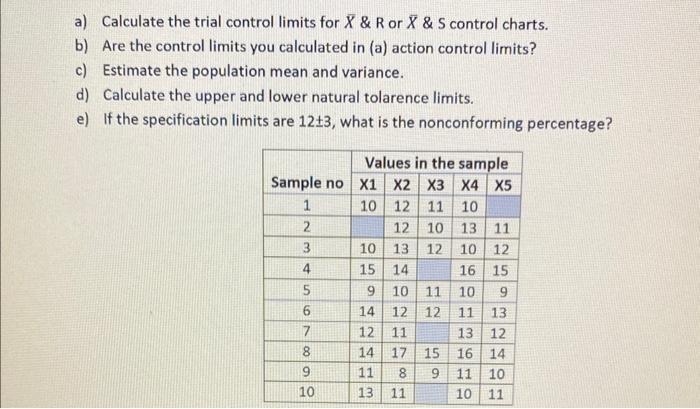
a) Calculate the trial control limits for X & R or X & S control charts. b) Are the control limits you calculated in (a) action control limits? c) Estimate the population mean and variance. d) Calculate the upper and lower natural tolarence limits. e) If the specification limits are 1213, what is the nonconforming percentage? Values in the sample Sample no X1 X2 X3 X4 X5 1 10 12 11 10 2 13 11 3 10 12 4 16 15 5 10 9 6 11 13 7 13 12 8 16 14 9 11 10 10 10 11 12 10 10 13 12 15 14 9 10 11 12 12 14 12 11 14 17 15 11 8 9 13 11
Step by Step Solution
3.42 Rating (152 Votes )
There are 3 Steps involved in it
To calculate the trial control limits for Xbar and R control charts we need to compute the following values a Xbar Control Chart 1 Calculate the average Xbar for each sample 2 Calculate the overall av... View full answer

Get step-by-step solutions from verified subject matter experts