

Question: a . Calculate the upper and lower control limits and the center lines for the mean ( x ) and range ( R ) charts
a Calculate the upper and lower control limits and the center lines for the mean and range
charts based on the first samples when the process is known to be in control. Use the
"factors" given in class slides. points
b Construct the appropriate control charts showing all samples points
c Is the process still in control? Why or why not? points
Problem
Best Book Stand is a manufacturer of wooden bookstands. The production manager at Best
Book Stand tracks the number of defective book stands out of each lot of finished products
every week. The following data for weeks was collected when the production process was
known to be in control.
In order to continuously check if the process is still under control, the manager continued collecting
data for ten more weeks. Again, data indicates the number of defective book stands per lot of
for each week.
a Calculate the upper and lower control limits and the center lines for the proportion of
defective book stands using data from when the process was known to be in control. points
b Construct the appropriate control charts showing all samples. points
c Is the process still in control? Why or why not? points
Problem
Caman Biscuits produces fruit flavored wafers. The company estimates that each wafer should
be at least inches and at most inches thick. The company is considering outsourcing
the wafer production to Warm Biscuits Company. Warm Biscuits produces wafers of normally
distributed thickness with a mean of inches and standard deviation of inches. Caman
Biscuits aims for performance for all its products.
a Calculate Is Warm Biscuit's process capable of producing wafers at the performance level
specified by Caman? Please explain your answer. points
b Using check if Warm Biscuit's process is capable of producing wafers at the performance
level specified by Caman? Explain your answer. points Problem Short Answer
a Describe the difference between common cause and special cause variation. Provide an
example for each when eating at a restaurant. points
b Describe the four different types of costs associated with quality. Give an example of each for
a doctor's office. pointsProblem
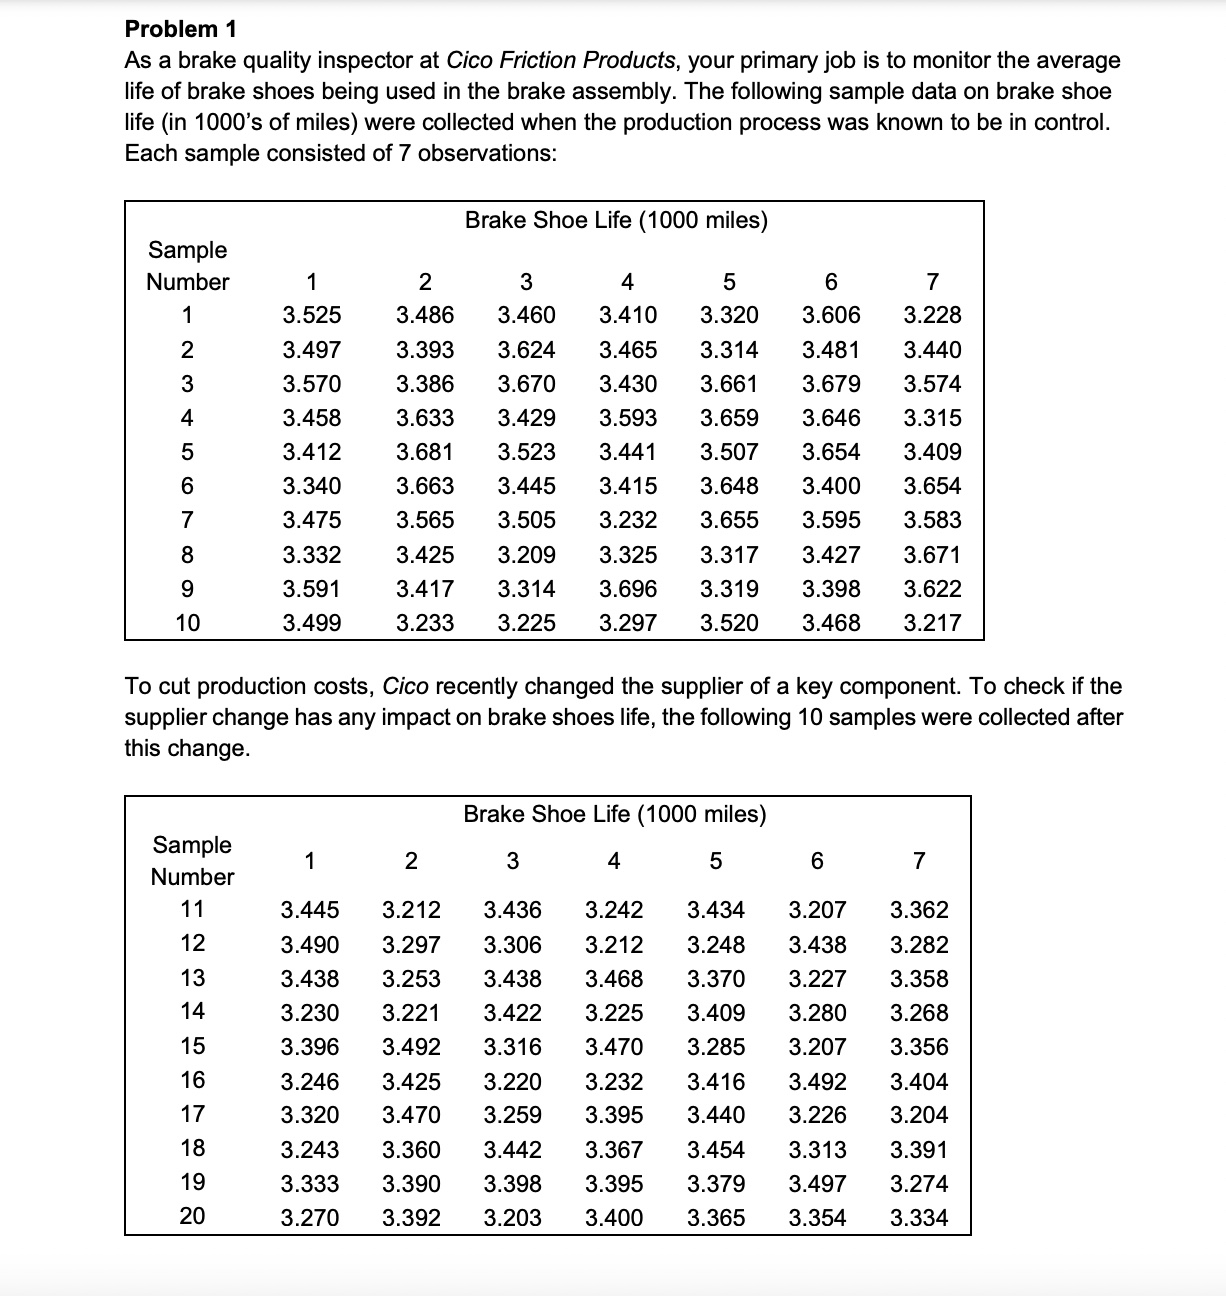
As a brake quality inspector at Cico Friction Products, your primary job is to monitor the average
life of brake shoes being used in the brake assembly. The following sample data on brake shoe
life in s of miles were collected when the production process was known to be in control.
Each sample consisted of observations:
To cut production costs, Cico recently changed the supplier of a key component. To check if the
supplier change has any impact on brake shoes life, the following samples were collected after
this change.
take your time there is a lot here
Step by Step Solution
There are 3 Steps involved in it
1 Expert Approved Answer
Step: 1 Unlock

Question Has Been Solved by an Expert!
Get step-by-step solutions from verified subject matter experts
Step: 2 Unlock
Step: 3 Unlock