

Question: A car is initially at rest on a straight road. The histogram below shows the car's speed along that road (the x-axis) as a function
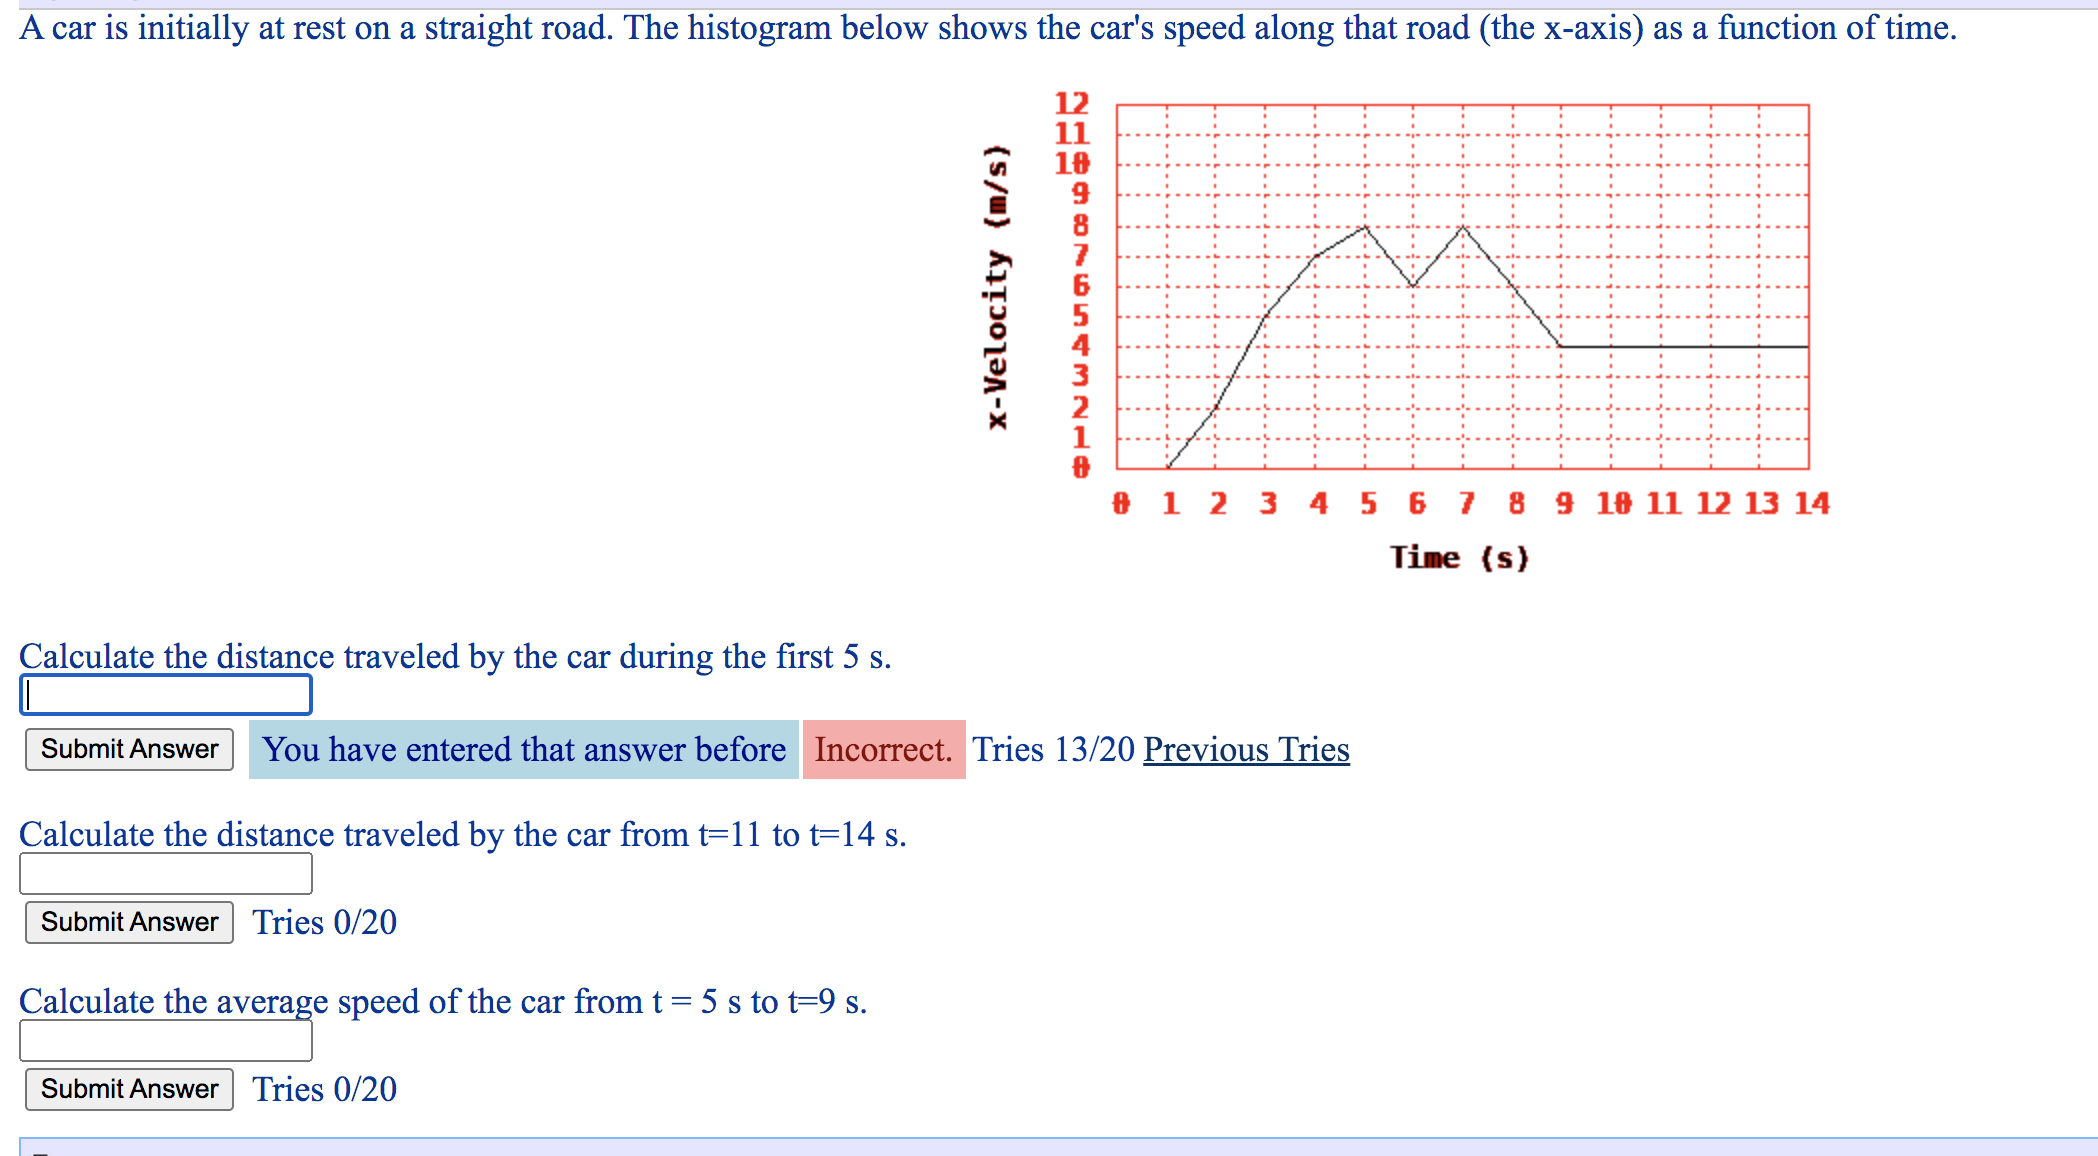
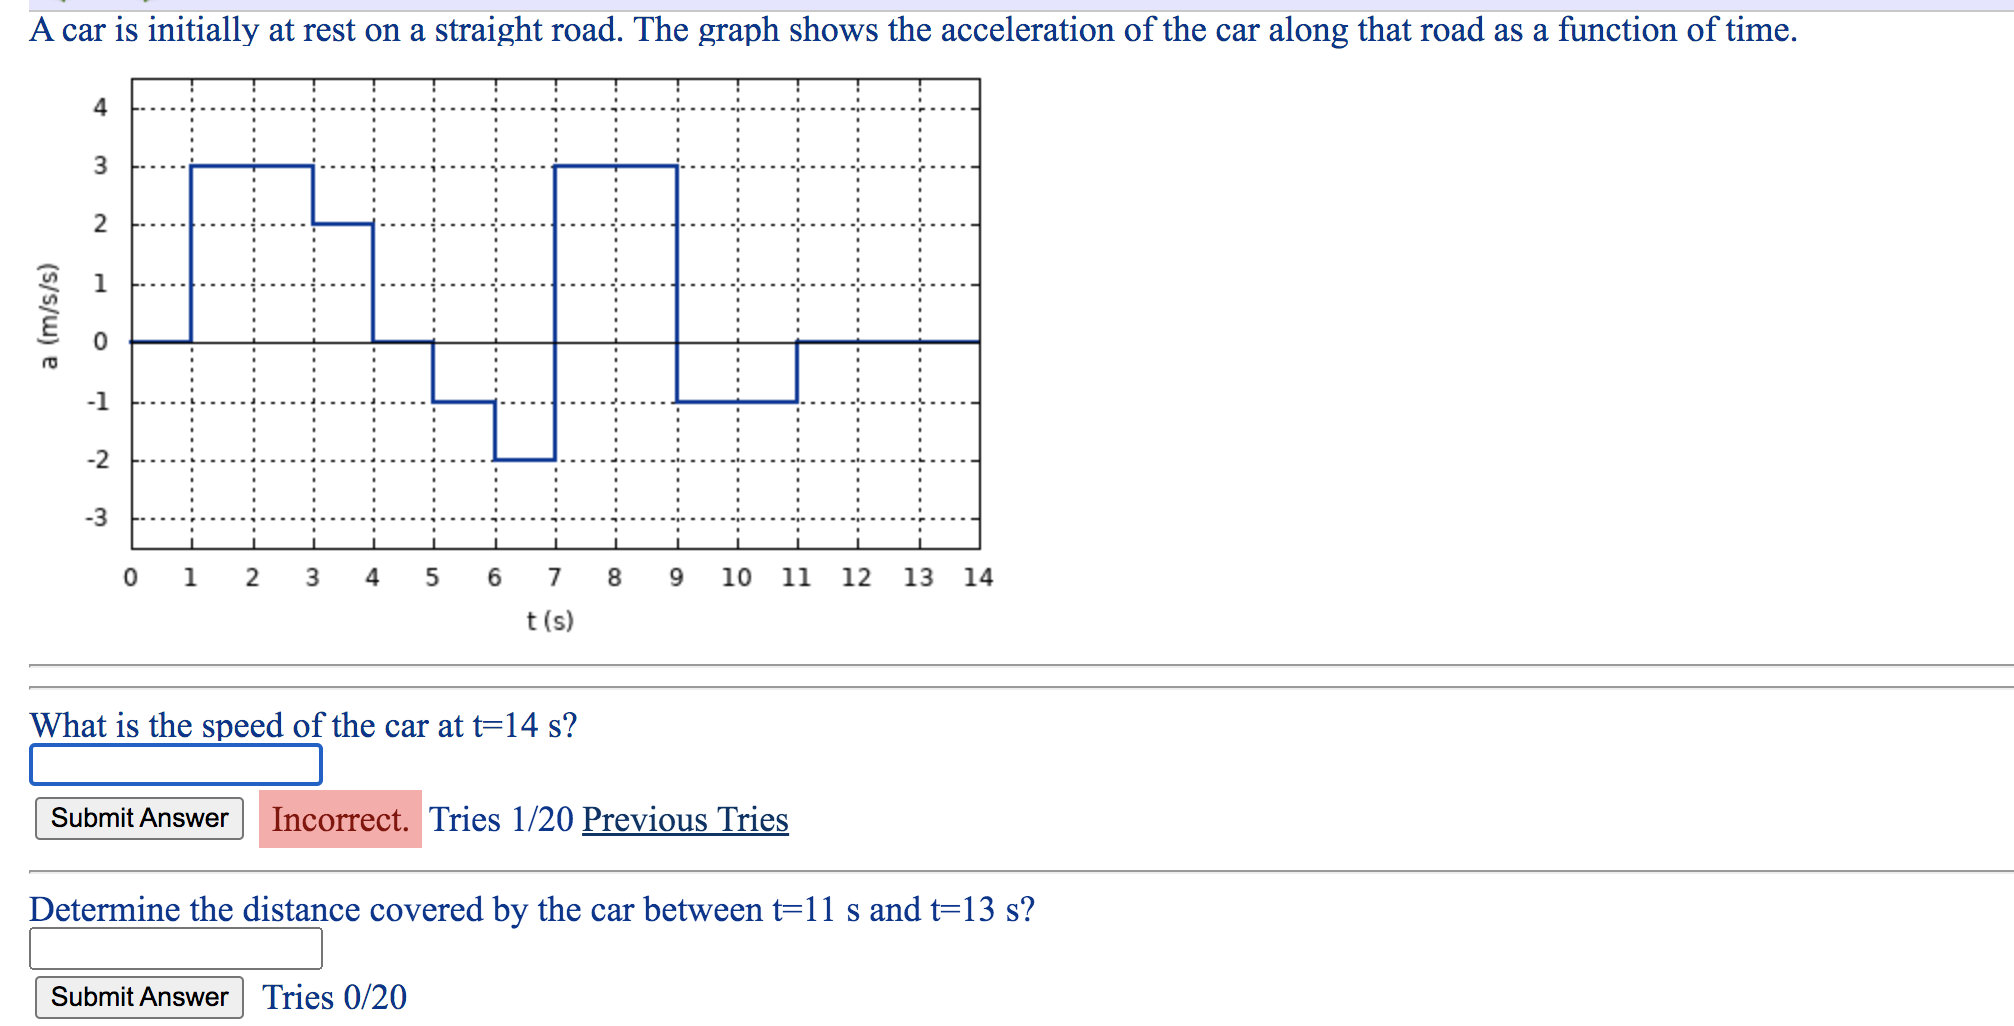
A car is initially at rest on a straight road. The histogram below shows the car's speed along that road (the x-axis) as a function of time. x-Velocity (m/s) 0 1 2 3 4 5 6 7 8 9 10 11 12 13 14 Time (s) Calculate the distance traveled by the car during the first 5 s. Submit Answer You have entered that answer before Incorrect. Tries 13/20 Previous Tries Calculate the distance traveled by the car from t=11 to t=14 s. Submit Answer Tries 0/20 Calculate the average speed of the car from t = 5 s to t=9 s. Submit Answer Tries 0/20A car is initially at rest on a straight road. The graph shows the acceleration of the car along that road as a function of time. a (m/s/s) 'What is the speed of the car at t=14 s? Incorrect. Tries 1/20 Previous Tries Determine the distance covered by the car between t=11 s and t=13 s? Tries 0120
Step by Step Solution
There are 3 Steps involved in it

Get step-by-step solutions from verified subject matter experts