

Question: A certain radioactive element decays according to the following function: N = N. ert. N is the amount of radioactive element after time t, N.
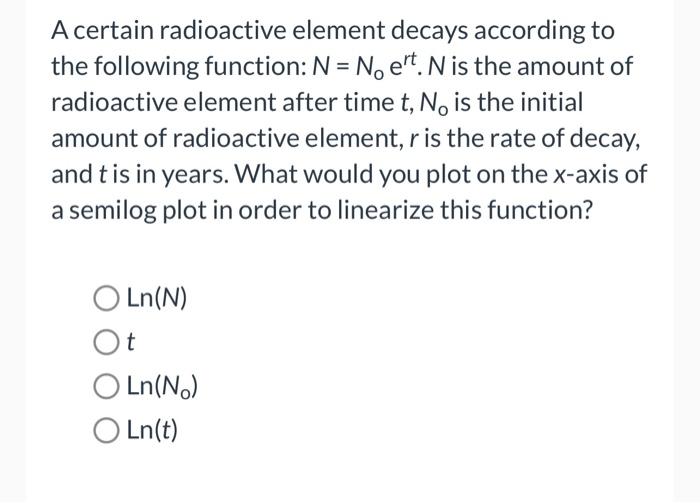
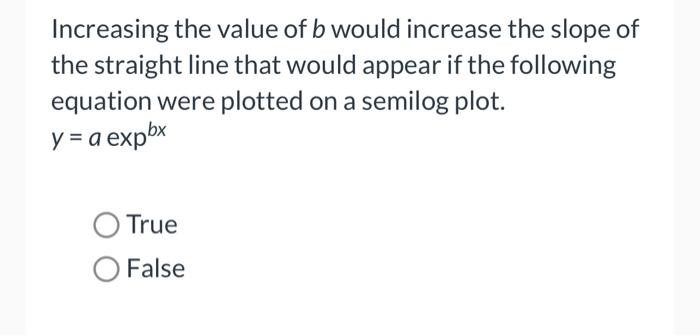
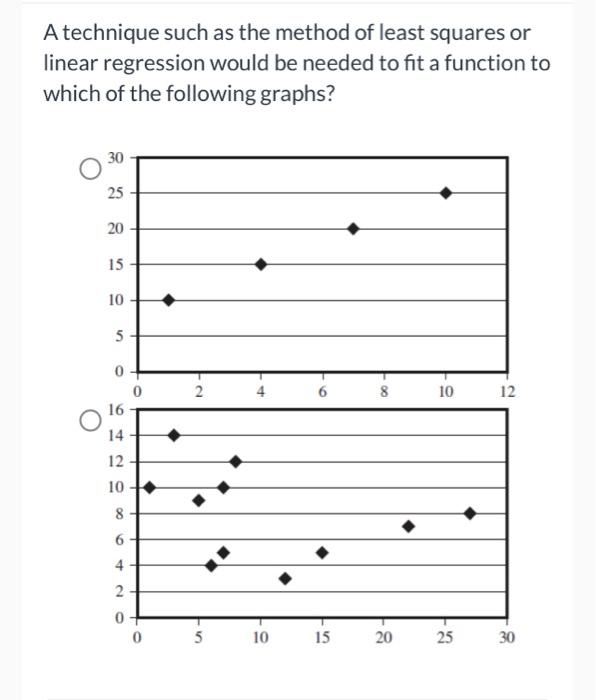
A certain radioactive element decays according to the following function: N = N. ert. N is the amount of radioactive element after time t, N. is the initial amount of radioactive element, r is the rate of decay, and t is in years. What would you plot on the x-axis of a semilog plot in order to linearize this function? O Ln(N) Ot OLn(N.) O Ln(t) Increasing the value of b would increase the slope of the straight line that would appear if the following equation were plotted on a semilog plot. y = a expbx True O False A technique such as the method of least squares or linear regression would be needed to fit a function to which of the following graphs? 30 25 20 15 10 5 2 4 6 8 10 12 0 0 16 14 12 10 8 6 4 2 0 0 5 10 15 20 25 30
Step by Step Solution
There are 3 Steps involved in it

Get step-by-step solutions from verified subject matter experts