

Question: A certain type of candy is reported to be distributed with the color percentages shown in the table below. The number of each color in
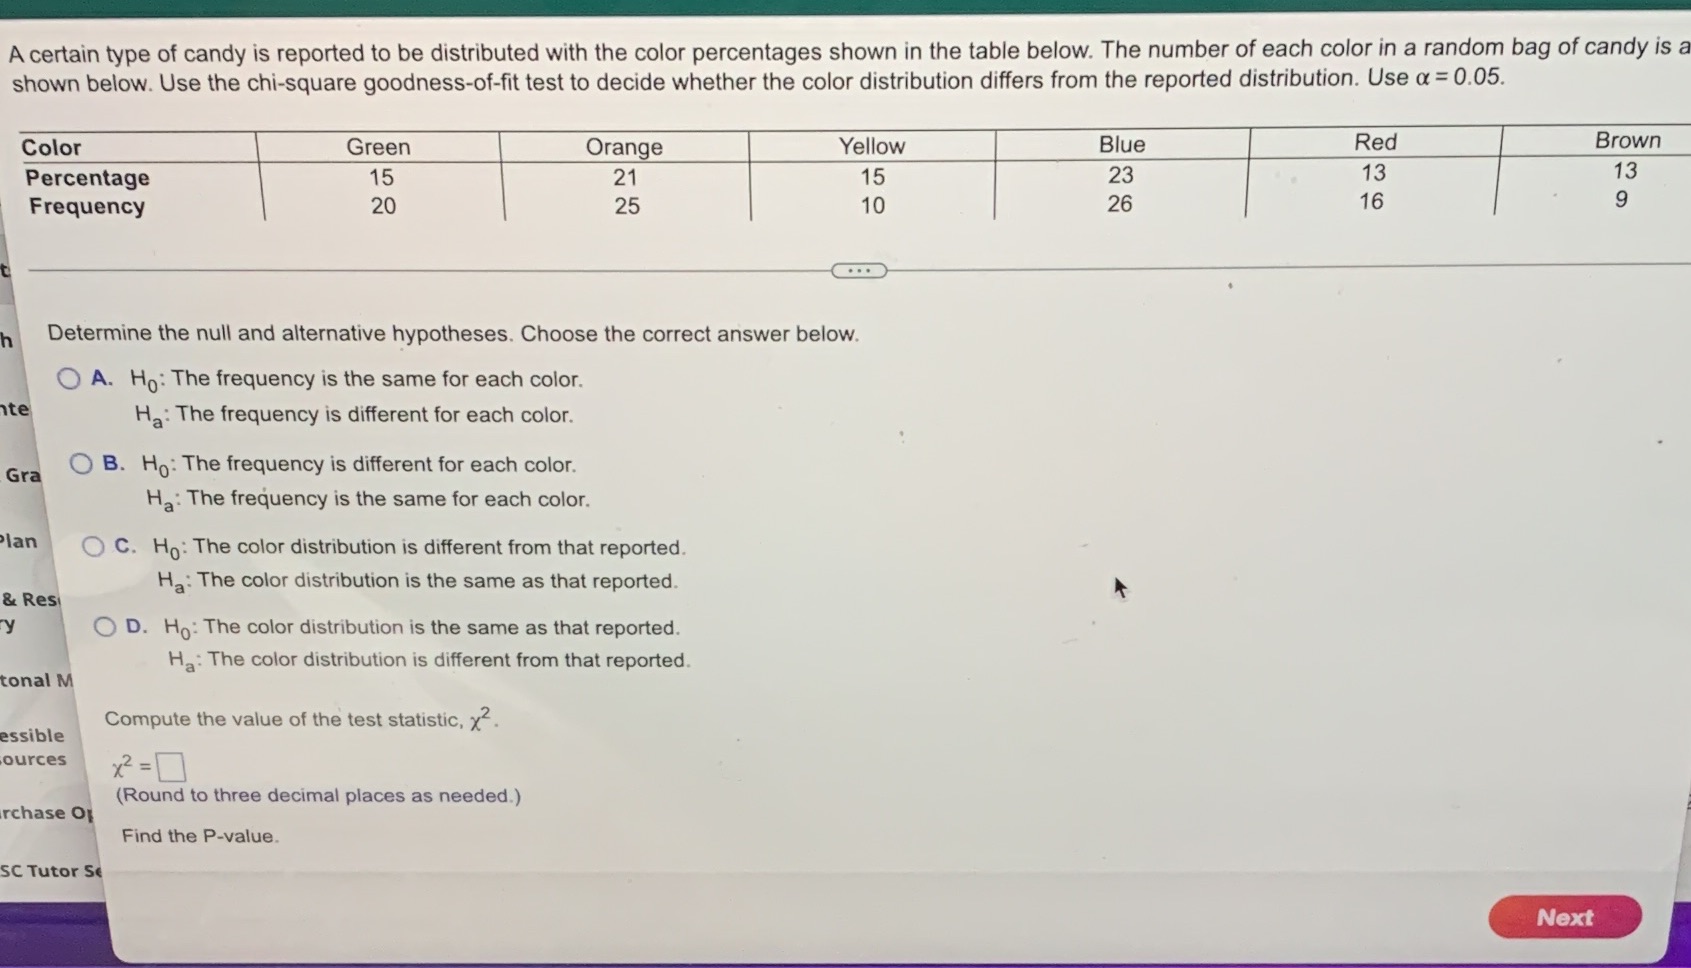
A certain type of candy is reported to be distributed with the color percentages shown in the table below. The number of each color in a random bag of candy is a shown below. Use the chi-square goodness-of-fit test to decide whether the color distribution differs from the reported distribution. Use a = 0.05. Color Green Orange Yellow Blue Red Brown Percentage 15 21 15 23 13 13 Frequency 20 25 10 26 16 9 Determine the null and alternative hypotheses. Choose the correct answer below. O A. Ho: The frequency is the same for each color. te Ha: The frequency is different for each color. Gra O B. Ho: The frequency is different for each color. Ha: The frequency is the same for each color. Plan O C. Ho: The color distribution is different from that reported. Ha: The color distribution is the same as that reported. & Rest ry O D. Ho: The color distribution is the same as that reported. Ha: The color distribution is different from that reported. tonal M Compute the value of the test statistic, x2. essible ources X2 =] (Round to three decimal places as needed.) rchase Of Find the P-value. SC Tutor Se Next
Step by Step Solution
There are 3 Steps involved in it

Get step-by-step solutions from verified subject matter experts