

Question: A certain type of candy is reported to be distributed with the color percentages shown in the table below. The number of each color
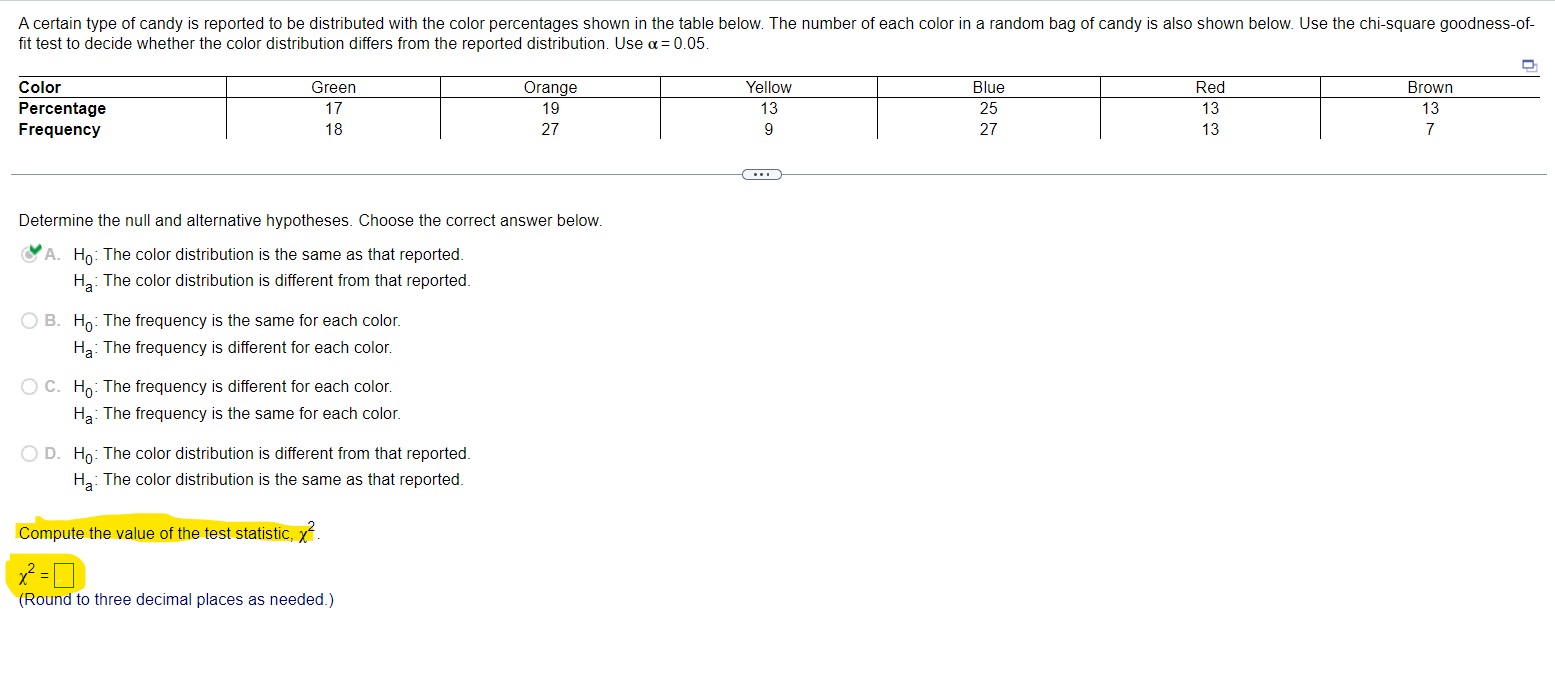
A certain type of candy is reported to be distributed with the color percentages shown in the table below. The number of each color in a random bag of candy is also shown below. Use the chi-square goodness-of- fit test to decide whether the color distribution differs from the reported distribution. Use = 0.05. Color Percentage Frequency Green 17 18 Orange 19 27 Yellow 13 9 Blue 25 27 Red 13 13 Brown 13 7 Determine the null and alternative hypotheses. Choose the correct answer below. A. Ho: The color distribution is the same as that reported. Ha: The color distribution is different from that reported. B. Ho: The frequency is the same for each color. Ha: The frequency is different for each color. C. Ho: The frequency is different for each color. Ha The frequency is the same for each color. OD. Ho: The color distribution is different from that reported. Ha: The color distribution is the same as that reported. Compute the value of the test statistic, x. (Round to three decimal places as needed.)
Step by Step Solution
There are 3 Steps involved in it

Get step-by-step solutions from verified subject matter experts