

(a) Check signs and magnitudes of estimates. Is the sign of each estimated coefficient consistent with economic...
Question:
(a) Check signs and magnitudes of estimates. Is the sign of each estimated coefficient consistent with economic theory? Briefly explain your answer for each coefficient.
(b) Which variables are significant at a confidence level of 90% or higher? Which variable does not appear to have a statistically significant impact on water demand? How might you explain this observation?
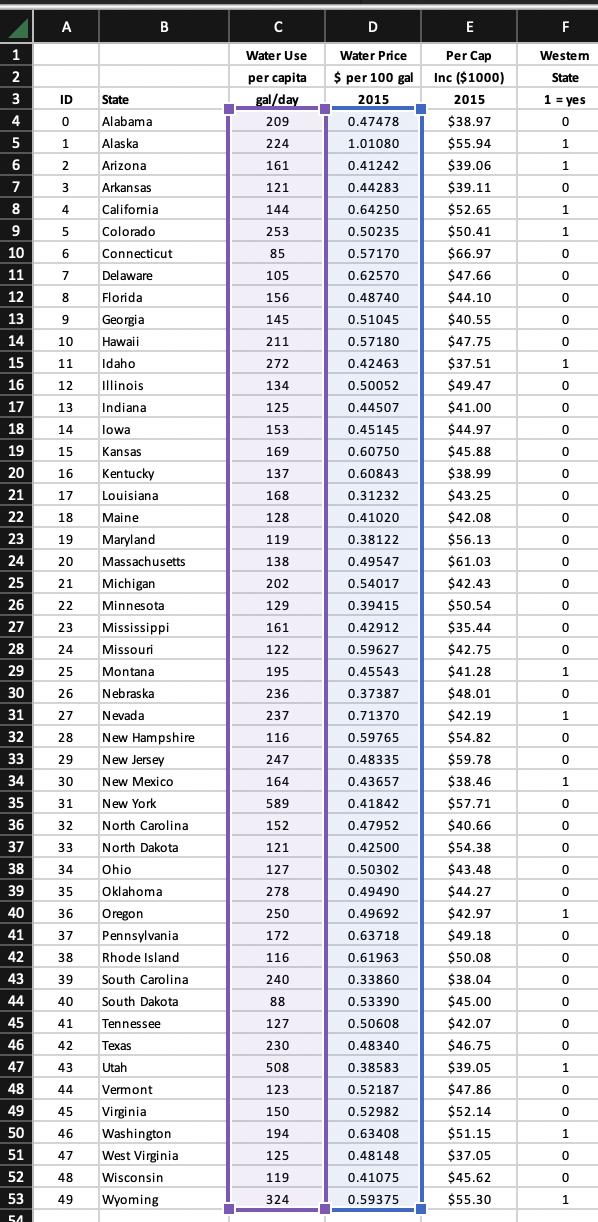
(c) Create a column in your Excel spreadsheet that shows the estimated water use for each state based on your model results (i.e., your formula will use the coefficients you estimated in the water demand model).
(d) Calculate the point elasticities of water demand for California and Idaho using the correct model coefficients (dQ/dP), the given price for each state, and the estimated water use for each state determined in part (c), above. Show your work.
(e) Suppose California and Idaho want to decrease annual water use by 20% by taxing withdrawals. Use the estimated elasticities for California and Idaho in part (d) to determine the percentage increase in water price needed to decrease water use 20% in these states. Show your work.
Expert Answer:
a The sign of the estimated coefficient for population is positive which is consistent with economic ... View the full answer


Introduction To Statistical Investigations
ISBN: 9781118172148
1st Edition
Authors: Beth L.Chance, George W.Cobb, Allan J.Rossman Nathan Tintle, Todd Swanson Soma Roy
