

Question: a. Choose the correct graph for the time series and linear trend. The correct graph is B. c. The regression equation is Unit cost =
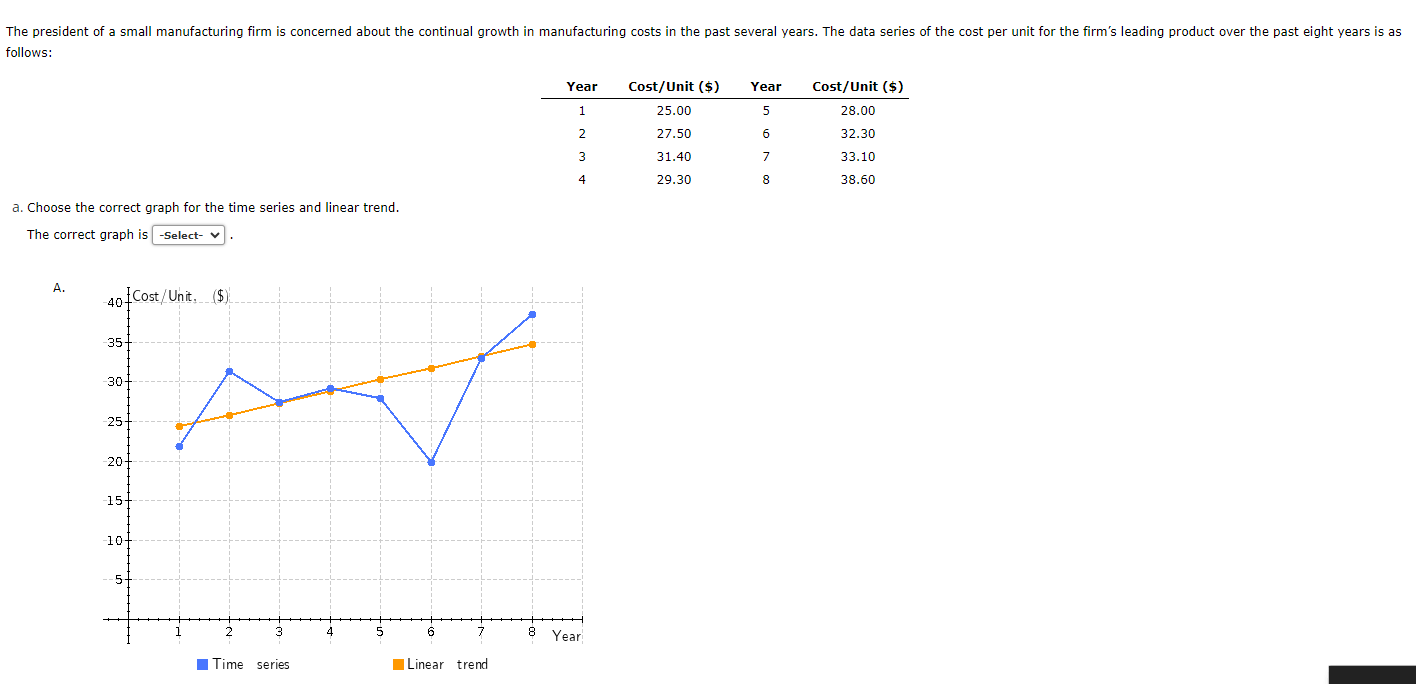
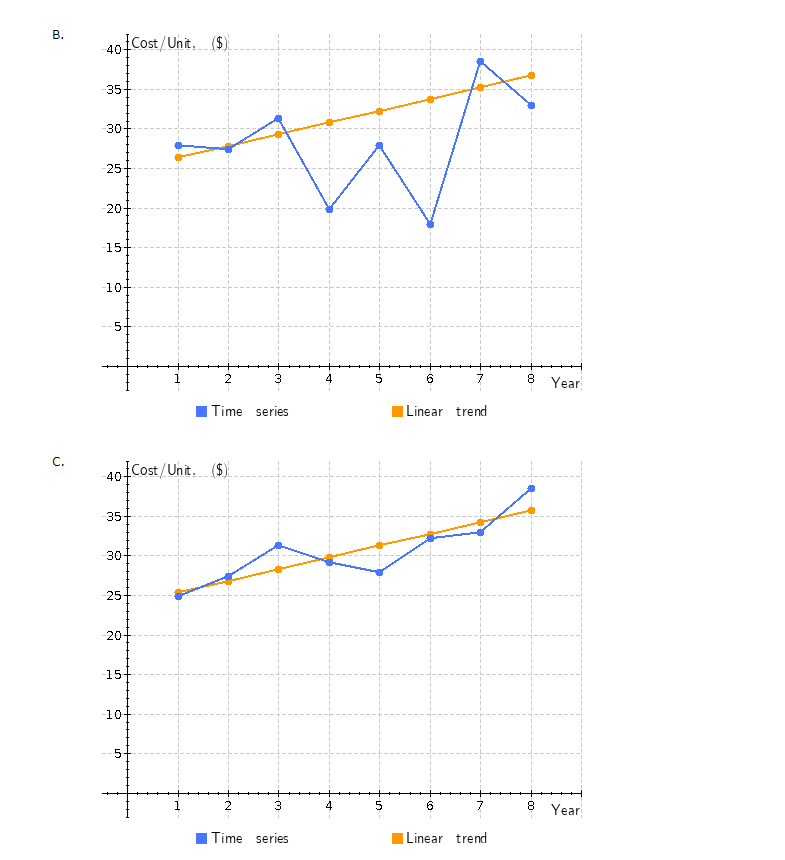
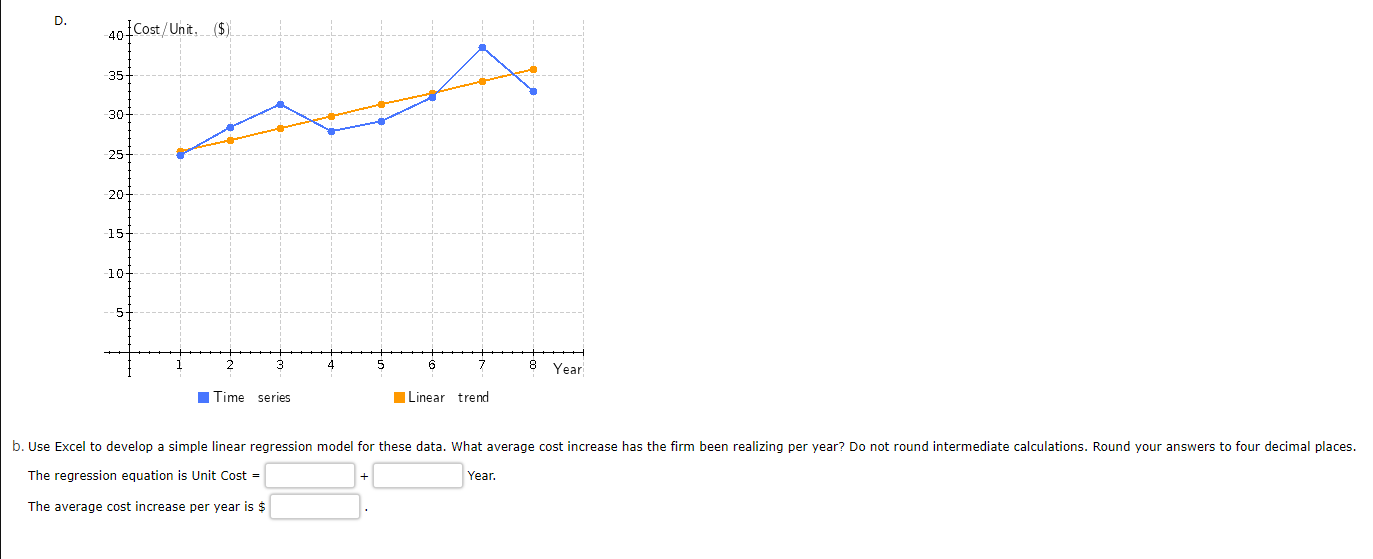
a. Choose the correct graph for the time series and linear trend. The correct graph is B. c. The regression equation is Unit cost = Year. The average cost increase per year is $
Step by Step Solution
There are 3 Steps involved in it
1 Expert Approved Answer
Step: 1 Unlock

Question Has Been Solved by an Expert!
Get step-by-step solutions from verified subject matter experts
Step: 2 Unlock
Step: 3 Unlock