

Question: A class earned scores on their midterm exam, class project, and their final grade in the course. The teacher created the following two scatterplots of
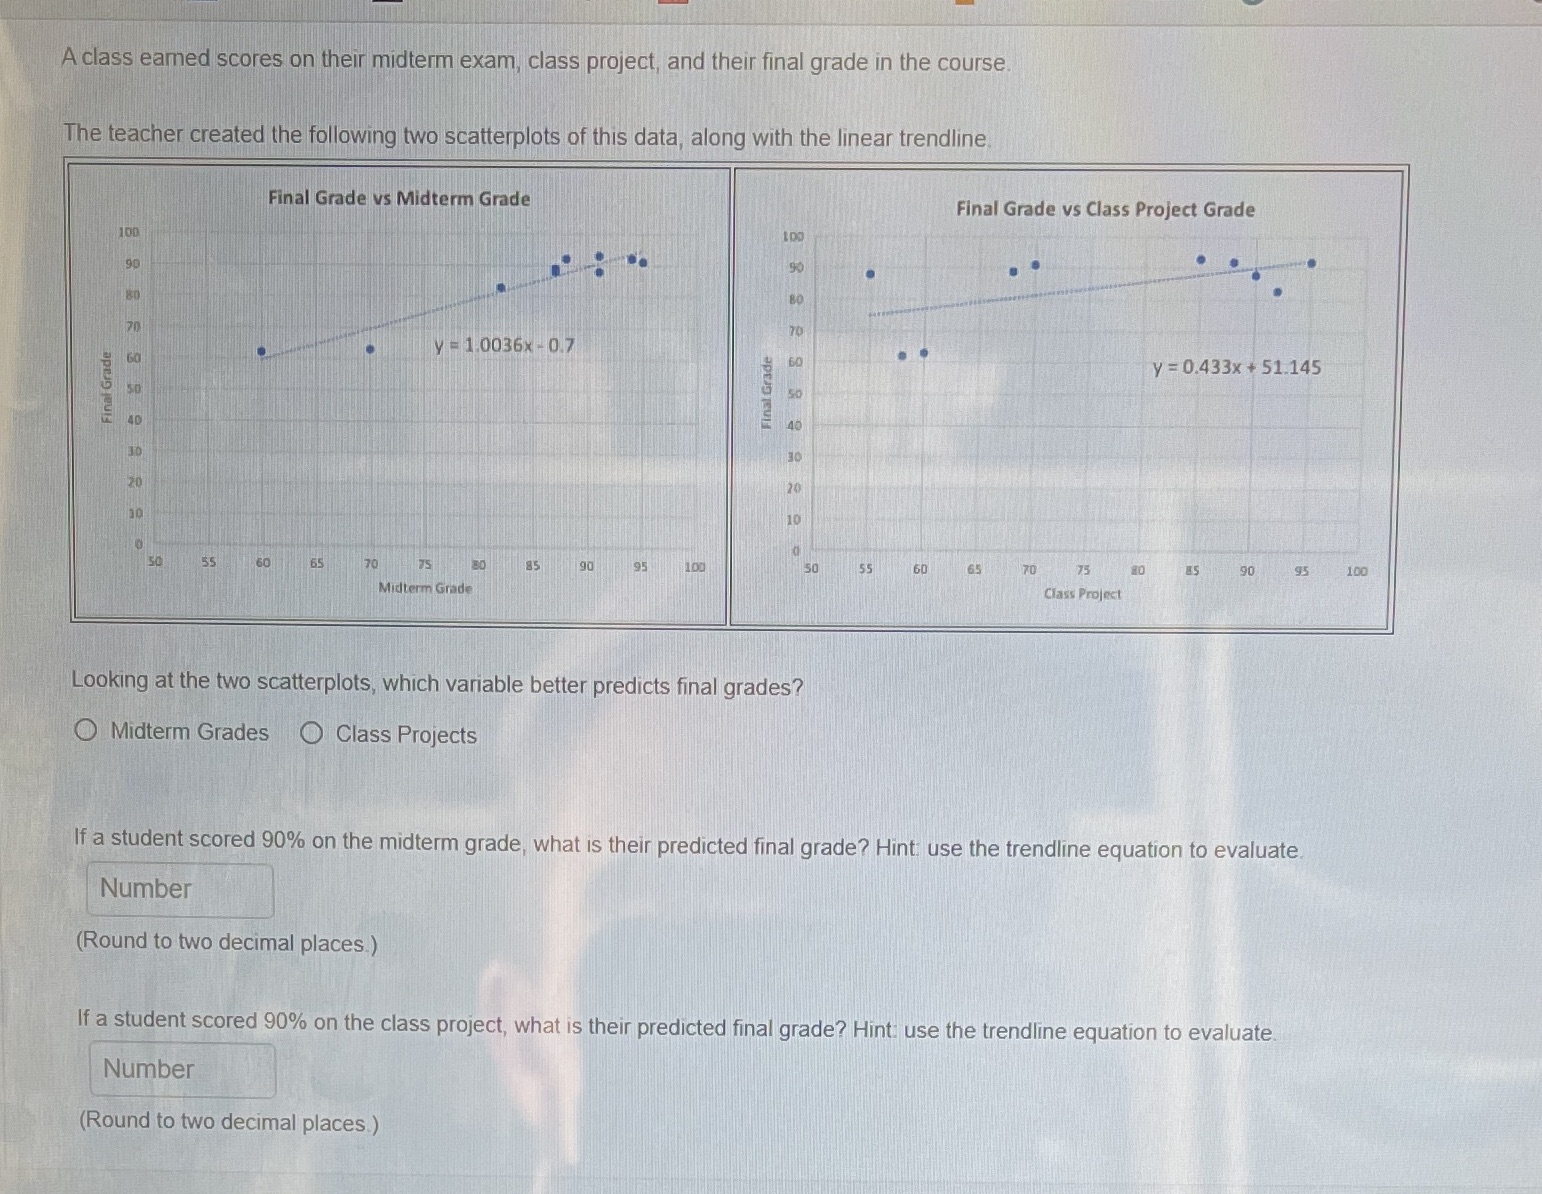
A class earned scores on their midterm exam, class project, and their final grade in the course. The teacher created the following two scatterplots of this data, along with the linear trendline Final Grade vs Midterm Grade Final Grade vs Class Project Grade 100 90 90 BO 70 70 y = 1.0036x - 0.7 y =0.433x + 51.145 So Final Grade 40 30 10 75 85 90 195 160 50 55 60 65 70 75 80 90 95 100 55 60 65 70 Midterm Grade Class Project Looking at the two scatterplots, which variable better predicts final grades? Midterm Grades O Class Projects If a student scored 90% on the midterm grade, what is their predicted final grade? Hint use the trendline equation to evaluate. Number (Round to two decimal places.) If a student scored 90% on the class project, what is their predicted final grade? Hint use the trendline equation to evaluate. Number (Round to two decimal places.)
Step by Step Solution
There are 3 Steps involved in it

Get step-by-step solutions from verified subject matter experts